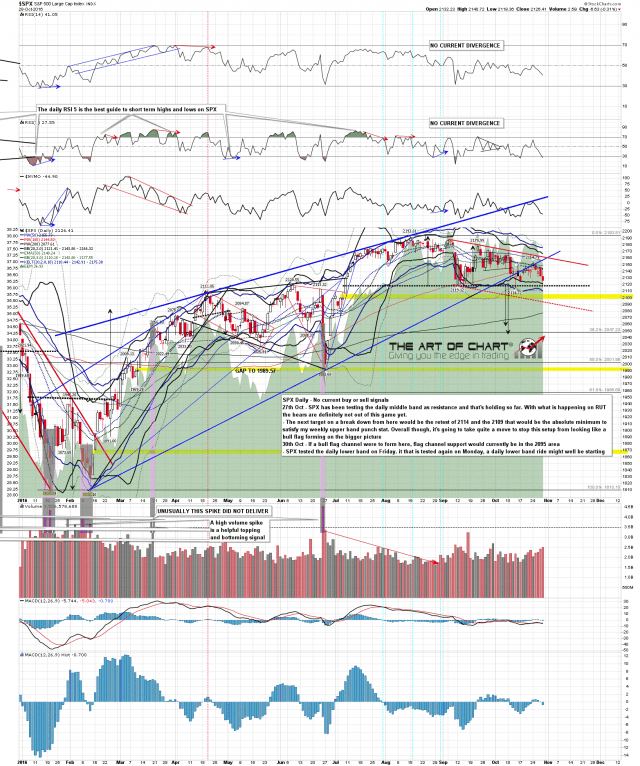
As downtrends go this has been uninspiring, but a lower low was made on Friday and I’m wondering about a possible flag channel support hit in the 2095 area. SPX daily chart:
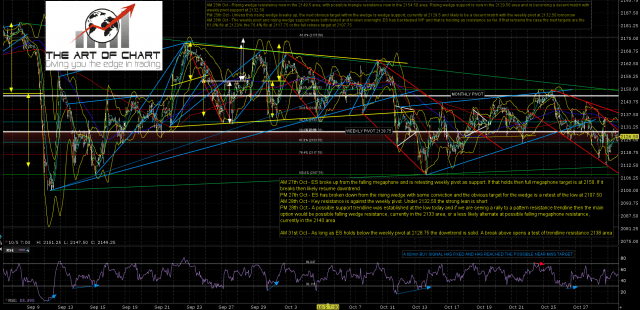
Short term resistance I’m taking from ES, and that is very definitely at the new weekly pivot at 2128.75 (2133/4 SPX area), which has already been tested and held twice so far this week. As long as that holds as resistance my lean is short. A break above opens up a possible higher resistance trendline test in the 2135/6 ES area (2140/1 SPX area). A break above there would look pretty bullish, and I’d then be looking at the potentially very bullish double bottom setup here on NQ. ES Dec 60min chart:
Strangely the first day of November tomorrow is the least bullish leaning day of this week historically, at about 52% bullish, but this is a bullish leaning week. Unless we see a break up this may be another dull week.
Stan and I are doing our monthly public Chart Chat at theartofchart.net on Sunday. That is free to all and seating is limited to 100, so if you want to attend you should register on this page here as soon as possible to make sure of a place. We’re be running through the usual 30 to 40 instruments over all the main trading market areas.
There’s something I also wanted to mention that we’ve been doing for a few weeks now that is free to all as well, and that is the weekly call posted on Sunday afternoons. Here is the one for this week. This is where we select a couple of futures that look like a good prospect for the week and these have been doing very well so far. Well worth a look if you trade futures and you can always find the current page under our main blog posts header here.


