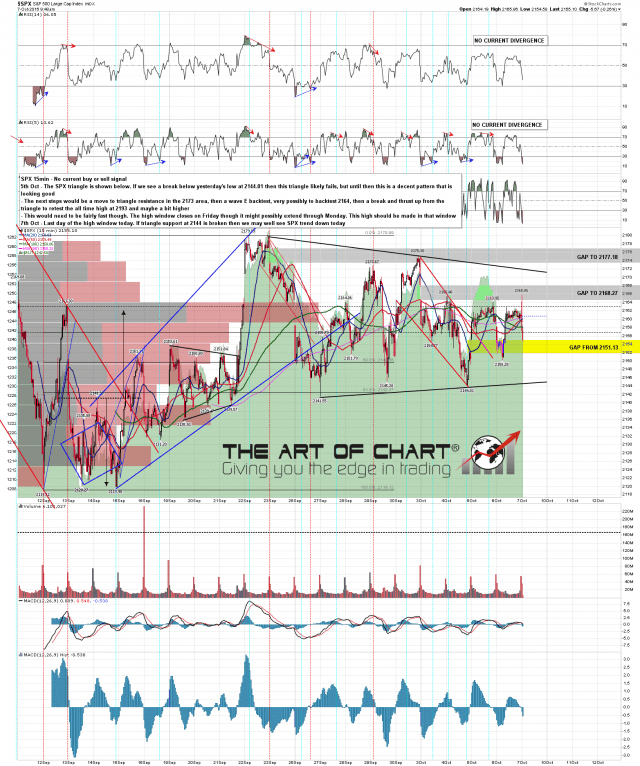
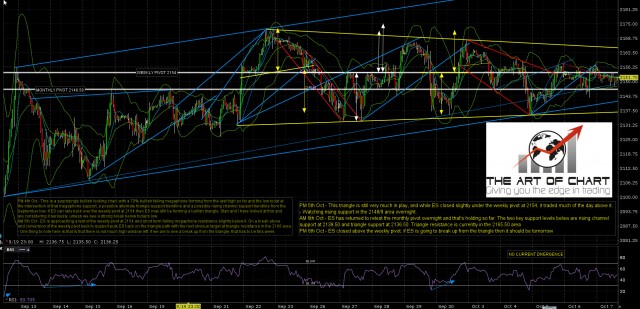
Today is the last day of the high window on SPX, and bulls have missed a couple of decent opportunities to break this up. With ES trading at 2151, the weekly pivot at 2154 was clearly never converted to support. If we are going to see a break up from this triangle then today is the last likely day to see that, and it’s not looking that promising at the time of writing.
Support levels to watch today on SPX are the 50 hour MA at 1259/60, the daily middle band at 2153, and triangle support at 2144/5. If we see a break down through 2144 then the chances are that break will follow through to the downside, and our expectation is that the downtrend that may already have started will likely dominate the remainder of October. SPX 15min chart:
Same setup on ES. ES Dec 60min chart:
We’ve been playing around with logos at the theartofchart.net, I’ve put a candidate example on the charts above. Our marketing guy thinks that the font isn’t readable enough. Opinions welcome 🙂
Today is the last trading day of our promotion at theartofchart.net to lock in the old prices before prices go up on Sunday night. I hope you’ve been enjoying the premarket videos I’ve been posting on twitter every day the last couple of weeks. These are going back to being subscriber only from today, so if you’d like to keep seeing those you can sign up for a free trial here. Today’s video has already been posted on my twitter and you can also see that video here. We’ll be bedding in the new subscribers for a while so I doubt if I’ll be actively marketing again before December, though as theartofchart.net is what I do every day, obviously it will still be mentioned most days.


