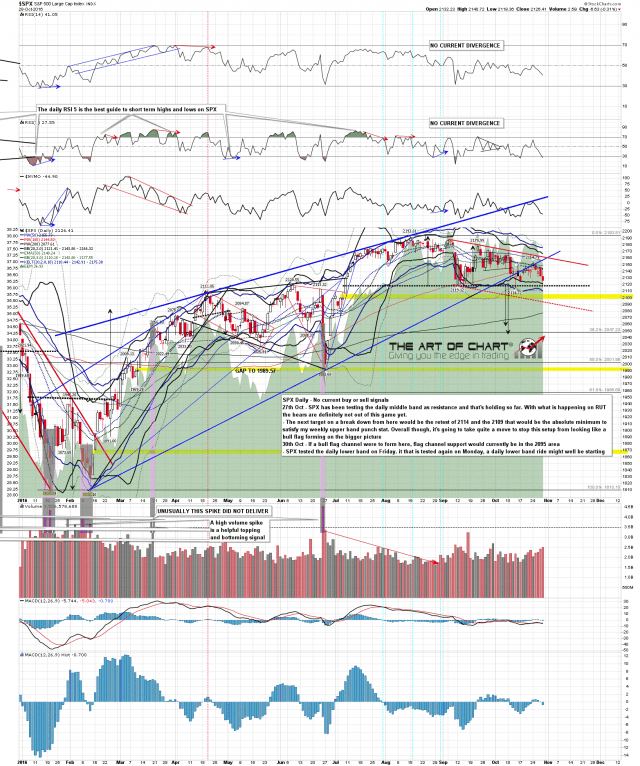
As downtrends go this has been uninspiring, but a lower low was made on Friday and I’m wondering about a possible flag channel support hit in the 2095 area. SPX daily chart:
Slope of Hope Blog Posts
Slope initially began as a blog, so this is where most of the website’s content resides. Here we have tens of thousands of posts dating back over a decade. These are listed in reverse chronological order. Click on any category icon below to see posts tagged with that particular subject, or click on a word in the category cloud on the right side of the screen for more specific choices.
Crude Target Reached
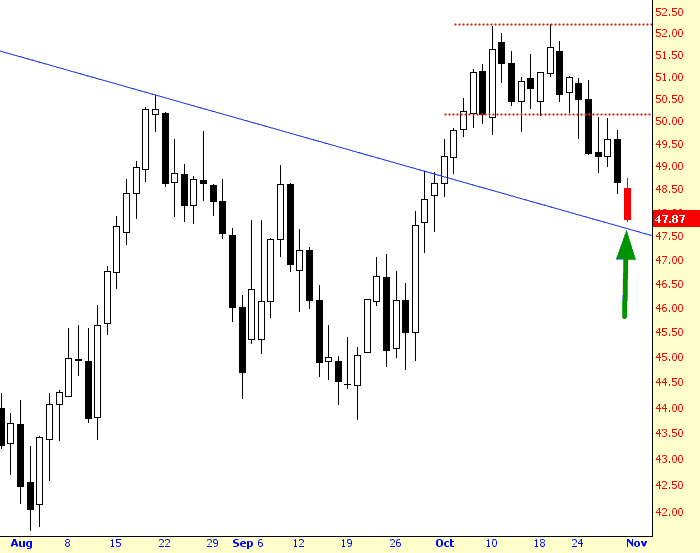
For weeks now, I’ve been saying that a drop in crude oil would take us to the blue trendline of support (formerly resistance). Sure enough, this morning we got our target:
The question is – – what next? I guess I’m more inclined to cover a few energy shorts now than before, although it’s always a little sad to say good-bye to a friend. Truth to tell, I’m probably not going to touch a damned thing yet.
Empty Promises
I was tidying up some things in my home office today, and I noticed a couple of binders that I hadn’t looked at in years. They were labeled “Tim’s Trading Tome” volumes one and two. In them were hundreds of pages and charts I had collected in late 2008, 2009, and 2010, Early 2009 of course, was the bottom of the market, and we began a multi-hundred-percent climb (in the case of some stocks, multi-thousand-percent) climb.
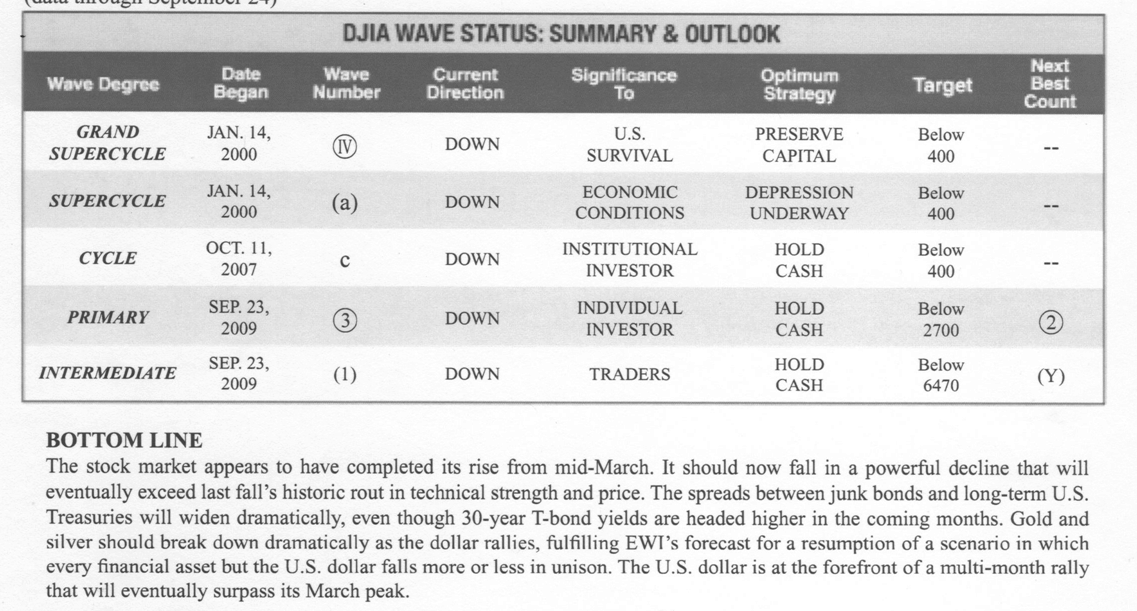
Naturally, though, on the heels of the financial crisis, there were plenty of popular publications that were saying it was the start of something much bigger. Here’s a snippet from one we all know:
Sunday ETF Quintet
Just nine days until election day, everyone. I’m sure we’ll be glad when it’s all over (more or less), but I think we can all at least agree it’s entertaining for the moment.
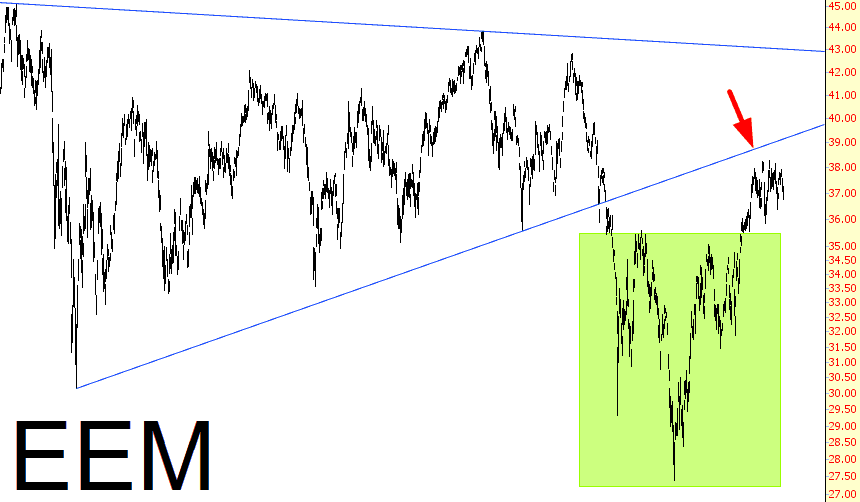
I thought I’d just thumb through a few ETF charts, since the market is still very “stuck” and there’s not a lot of dynamism to point out. This is short and sweet – five charts – so here we go: first is the emerging markets, which had a nice rally off its basing pattern (tinted) but seems to be getting turned away by a much larger trendline (red arrow shows resistance). The pattern for the Chinese ETF, symbol FXI, is rather similar.


