Just nine days until election day, everyone. I’m sure we’ll be glad when it’s all over (more or less), but I think we can all at least agree it’s entertaining for the moment.
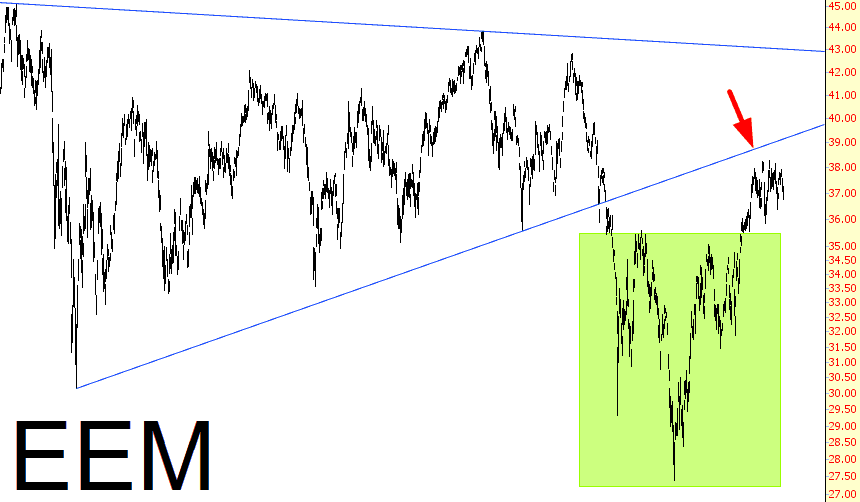
I thought I’d just thumb through a few ETF charts, since the market is still very “stuck” and there’s not a lot of dynamism to point out. This is short and sweet – five charts – so here we go: first is the emerging markets, which had a nice rally off its basing pattern (tinted) but seems to be getting turned away by a much larger trendline (red arrow shows resistance). The pattern for the Chinese ETF, symbol FXI, is rather similar.
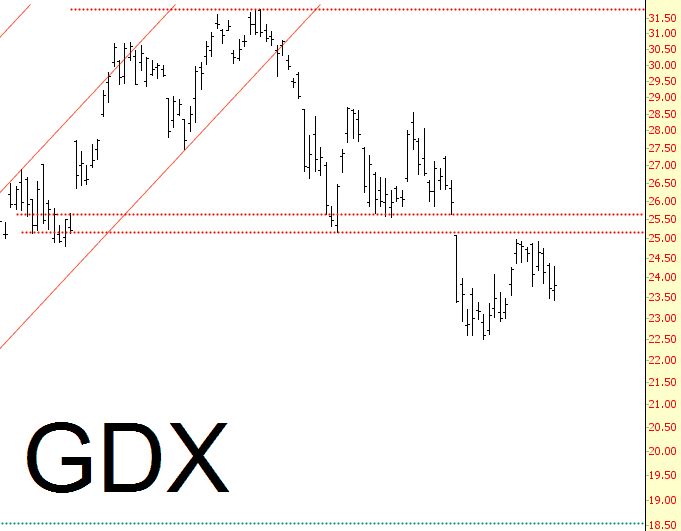
Precious metals miners are a favorite sector of mine these days, and the GDX and GDXJ patterns have to be two of the cleanest charts in existence today. Gold might battle its way back to about $1300, but I think it’s in trouble, a prospective rally notwithstanding.
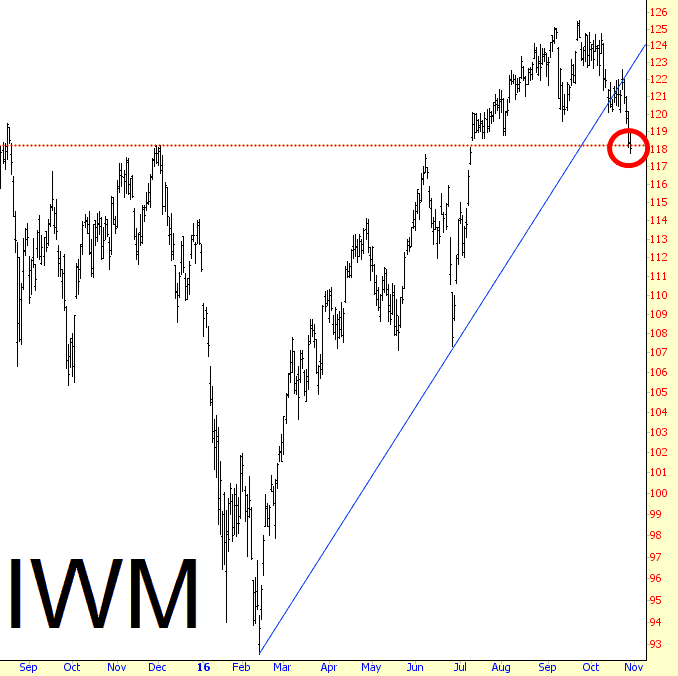
I was heartened to see that, at long last, the small caps have exhibited a failed bullish breakout pattern. An identical situation exists with the mid-caps, symbol MDY, not shown here.
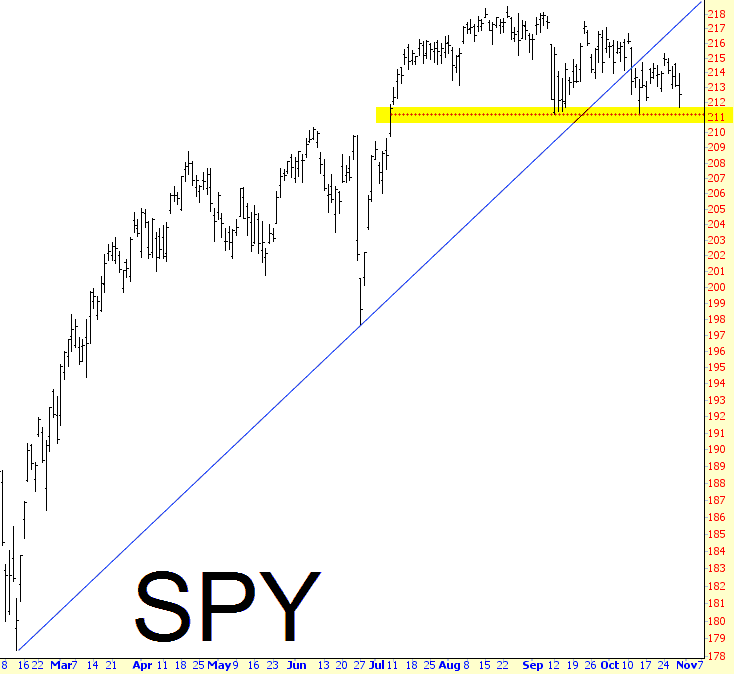
The much larger ETF SPY has yet to break its own support. Of course, it broke its 2016 uptrend a while ago (as did just about everything else), but the next bearish goal, a break of the tinted area, remains to be had. On the ES, this corresponds to 2100.25:
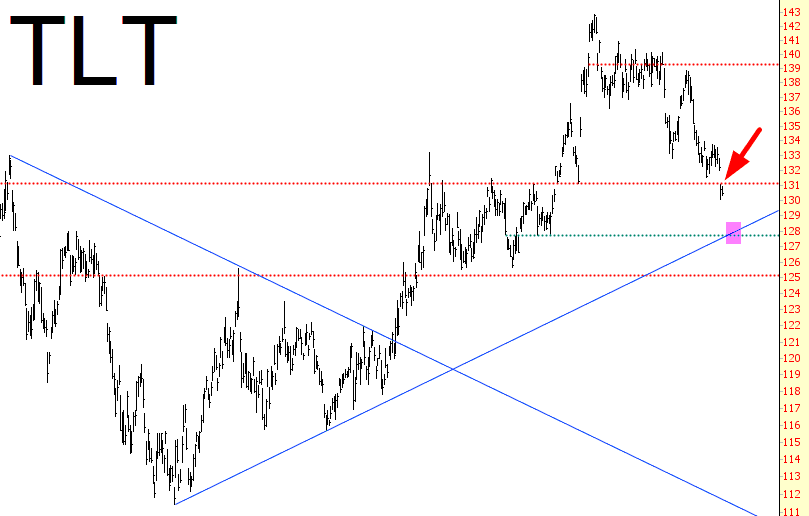
Lastly, bonds are breaking down badly as well. They, too, have a failed bullish breakout now, and should they break the area I’ve tinted below, the Fed’s desperate desire to create inflation and raise interest rates will be fulfilled. But I think “be careful what you wish for” applies.
In point of fact, as desperately as the central bankers of the world seem to want to create inflation, I would gently remind you that those same governments are neck-deep in debt unlike the world has ever seen before, and if you want the entire planet to drown in a financial bloodbath, having steadily climbing interest rates would do the trick nicely.


