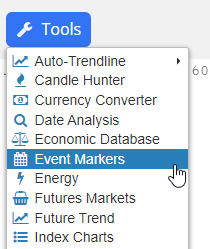
There is a library of date-based “events” built into SlopeCharts which subscribers can overlay on top of a chart. These events include holidays such as Memorial Day and Christmas as well as events from the world of finance such as FOMC announcement days. You can access this feature from the Tools menu:
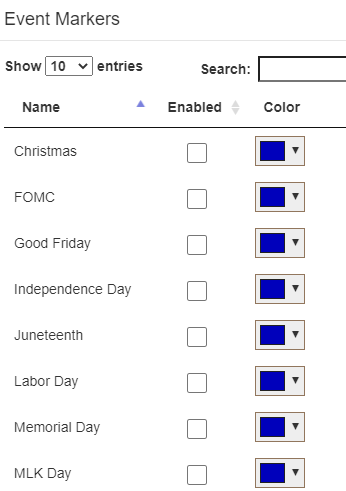
Choosing the Event Markers menu item brings up a dialog box showing, in alphabetical order, all the events from which you can choose. Click on Enabled to display that particular event, and, optionally, change the color of that event. If you are showing more than one event, it is helpful to have different colors to distinguish them from each other.
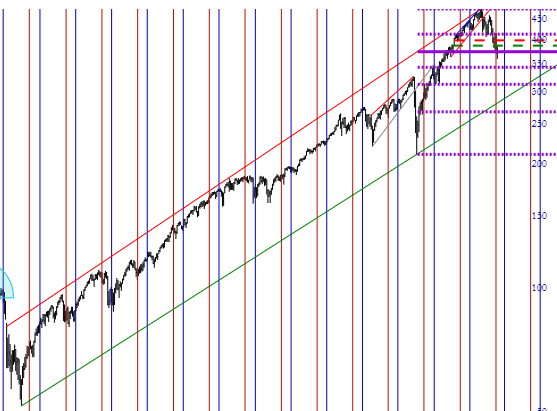
Below, for example, is the selection of Memorial Day and Labor Day from the events dialog.
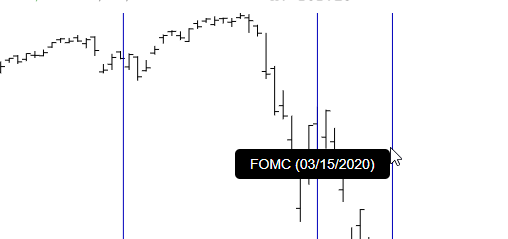
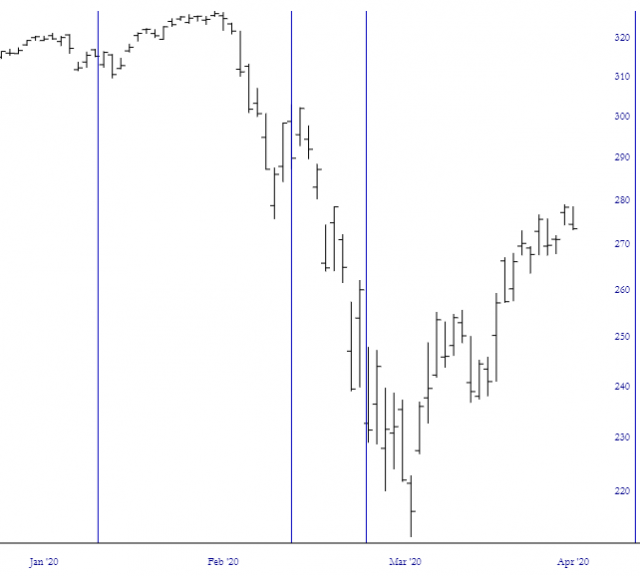
The purpose of this feature is to try to determine what, if any, behaviors or patterns tend to repeat themselves at or around specific events. It also is a helpful marker for extraordinary situations, such as the emergency meetings and announcements the Federal Reserve had in early 2020 when the Covid-19 crisis was starting.
By pointing at any specific line, you will see what that line represents and the exact date it took place.