The McClellan Summation is a study derived from the McClellan Oscillator, whose details you can read about here. You access it from the SlopeCharts Technical Studies menu, and its settings are the same as those you would find with the Oscillator:

Simply stated, the summation index moves up when the McClellan Oscillator is positive and it moves down when negative. Therefore, the line cumulatively moves up or down depending on the general direction of breadth with the components of the S&P 500.
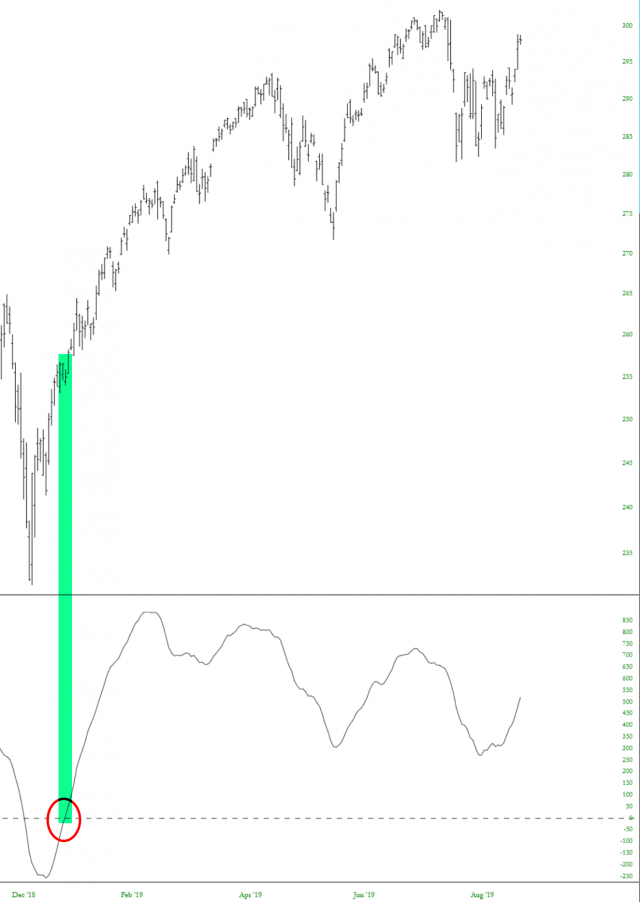
An example of a bullish crossover is shown below. The green tint indicates the point of the crossover into positive territory, and although the summation lagged the bottom by a few weeks, it still provided a buy signal that captured the majority of the move higher.
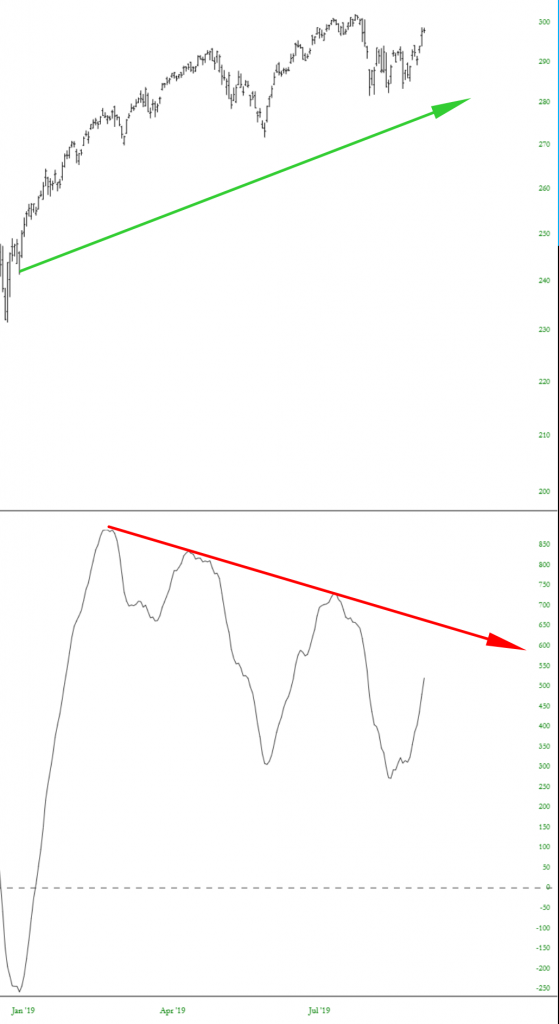
Divergences between price and summation can also provide insights. The chart below shows the popular SPY exchange traded fund moving persistently higher in price during most of 2019, while the summation index is deteriorating with a series of lower highs. This suggests the internal strength of the overall market is diminishing, and the strong equity market is concealing the fact that there is growing weakness beneath the surface of the positive headlines.