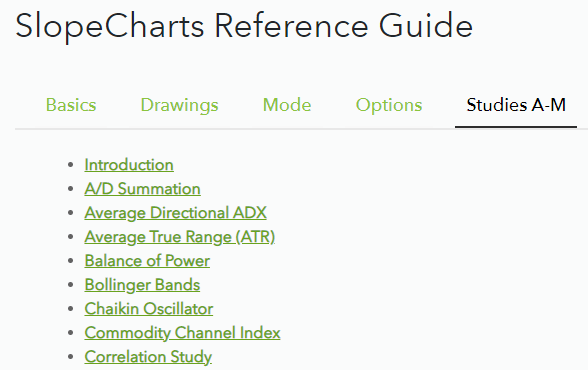
SlopeCharts has a wide variety of technical studies you can apply to charts. This is an introduction to this feature. If you are interested in the specifics of any individual study, please click here to go to the Reference guide, and click on the Studies tabs once you are there.
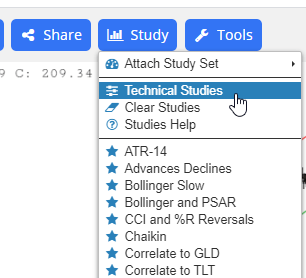
To invoke any technical study, select the menu item Technical Studies from the Study menu at the top of SlopeCharts:
Creating Study Panes
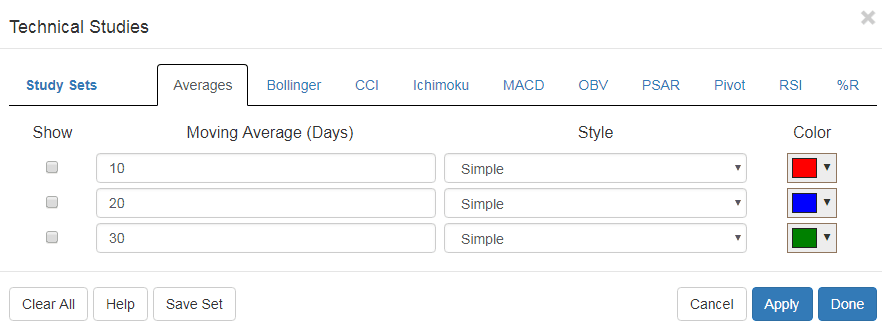
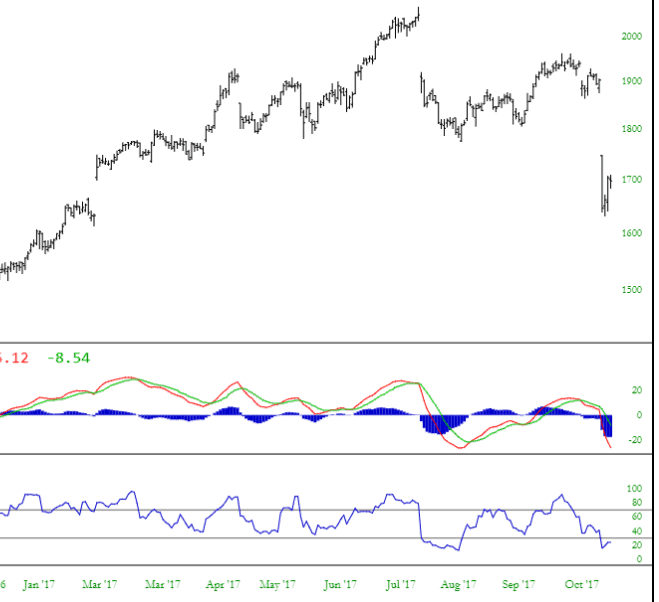
Next will appear a dialog box that allows you to customize and apply any technical indicators to any chart you display. Some studies, known as overlays, appear on top of charts (such as Averages, PSAR, and Bollinger), whereas others appear as separate panes (like MACD and RSI).
When new panes are added, they appear at the bottom of the chart.
Arranging the Panes
You can drag the dividing line between the chart and the study (or between the study and another study, if you are using more than one) in order to resize its height. Also, by holding down the Ctrl key and dragging the mouse, you can move the panes into any arrangement you want.
Over time, more indicators will be added to SlopeCharts, but the means of entering them by way of this dialog box will remain the same. You can mix and match indicators to your liking, and they will be applied to any and all charts you observe until such time as you “clear” the indicators via this same dialog box.
Fine-Tuning the Parameters
There is helpful information about each of these studies that you can access instantly by clicking the ? button on any one of the tabs. The Reference Guide lists details on all the studies.
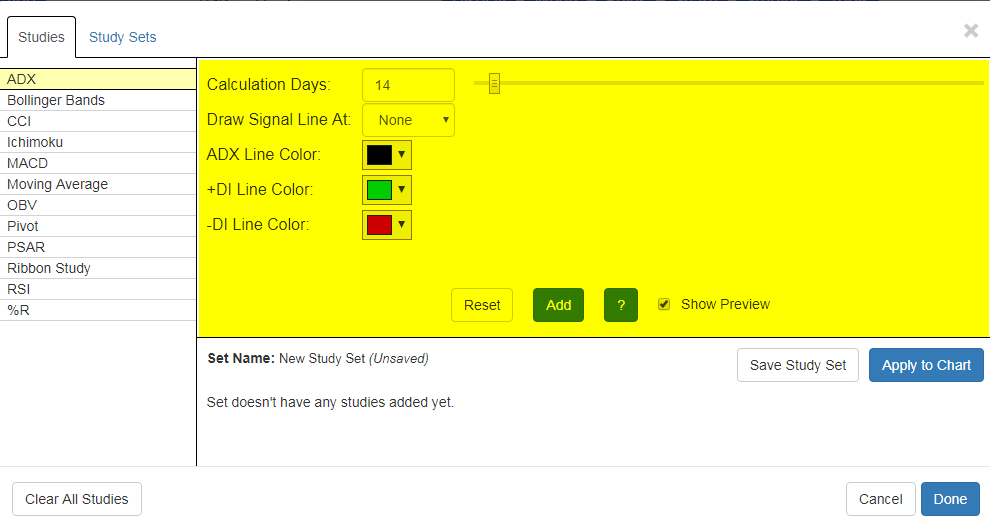
Let’s walk through how the dialog box is used. There are basically three steps to the process, each of which is oriented around a different portion of the dialog box.
The first step is to choose the technical indicator you want to add. You choose from the left side, tinted below.

After you choose an indicator, its parameters will be presented in the next section. One especially nice feature in SlopeCharts is that, for those indicators with a slide bar, you can slide it left and right and instantly witness the effect those changes make upon the study. When you are happy with the study’s settings, click Add.
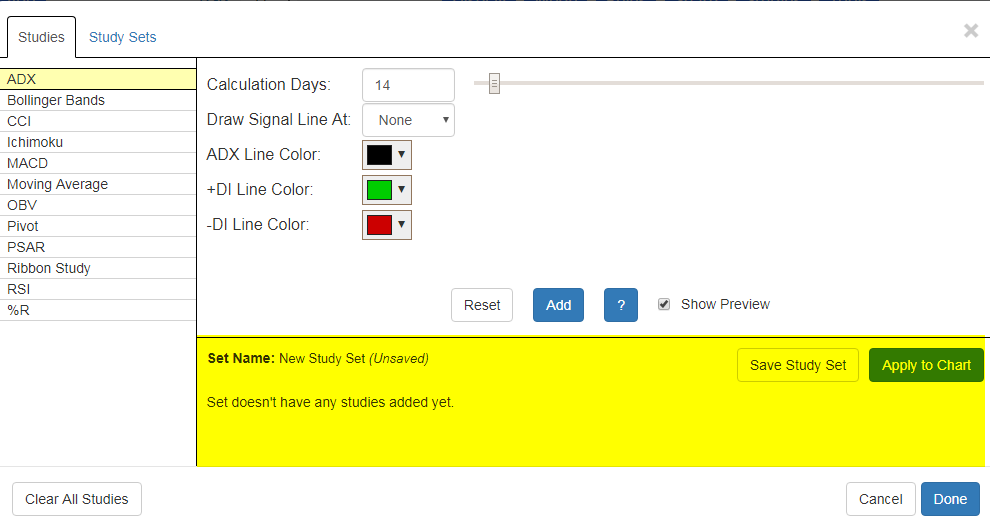
Creating and Organizing Study Sets
Any study you add will appear in the lower portion. You can delete any items in this area by clicking the red “X” which appears on its line, and you can double-click any of these studies to modify it. At first, there will be no studies in this section, but once you have assembled a collection that you like, you can click the Save Study Set button to preserve it.
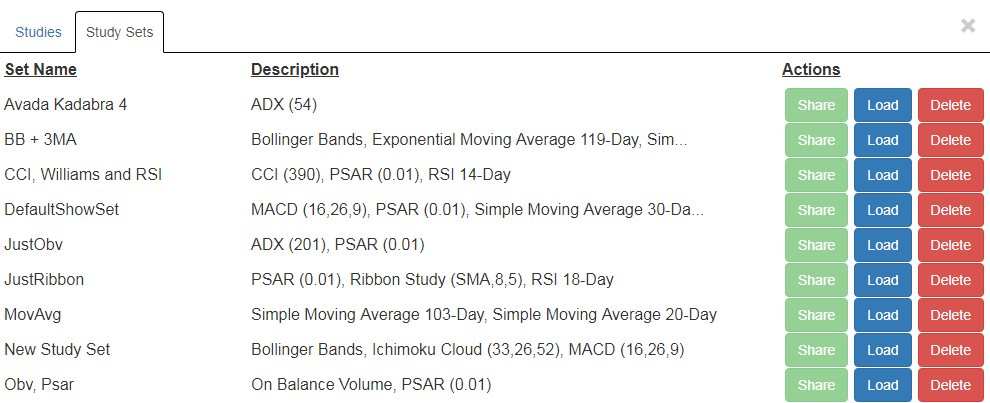
The study sets you created will appear on a separate tab labeled Study Sets. Here you can see the names, descriptions, and action buttons for every study set you have created. You can learn more about study sets on this page.
As you probably know, normally when you have technical studies “active”, they apply to every single symbol you examine. That’s the way it is on any website or any charting program. You choose the studies, and then you start going through your symbols, all of which will be enhanced by the studies.
Attaching a Study Set
There are some instances, though, when you don’t want that. perhaps there is one particular set of studies which you always want to see just for the Dow Jones Industrial Average, and nothing else. Using this new feature, you can “attach” that specific study set specifically to the $INDU (or whatever the symbol might be) so that it reliably appears for that symbol and no other. In other words, you won’t have the nuisance (or have to remember) to apply that specific study when you look at that particular symbol.
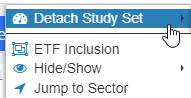
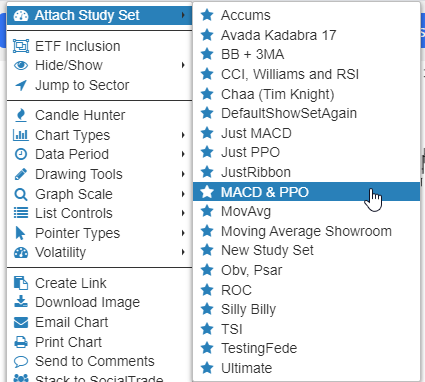
To use this feature, just right-click on the chart of the symbol you want to “attach’ to a study set, and select Attach Study Set. Specifically, choose the study set you’d like to associate with this particular symbol.
As always, you can hit Ctrl-S to toggle studies on or off (in case you want to temporary hide the study when looking at the symbol in question). If you want to eliminate the attachment altogether, just right-click the chart again while looking at that specific symbol and choose Detach Study Set.