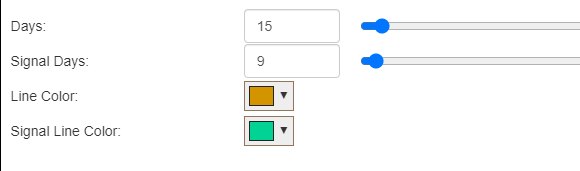
The TRIX is a momentum indicator that can provide signals by way of crossovers or divergences. To access the indicator, you can either select it from the Studies Q-Z menu or by way of the Technical Studies dialog box. Adding the TRIX will present to you these controls:
The controls available :
- Days: how many trading days should be using in calculating the moving average (the foundation of this indicator is that it is a moving average of a moving average of a moving average)
- Signal Days: how many trading days are using to create the signal line, which is the line used to indicate bullish (positive crossover) or bearish (negative crossover) signals
- Line Color and Signal Line Color: choose from any of thousands of possible colors
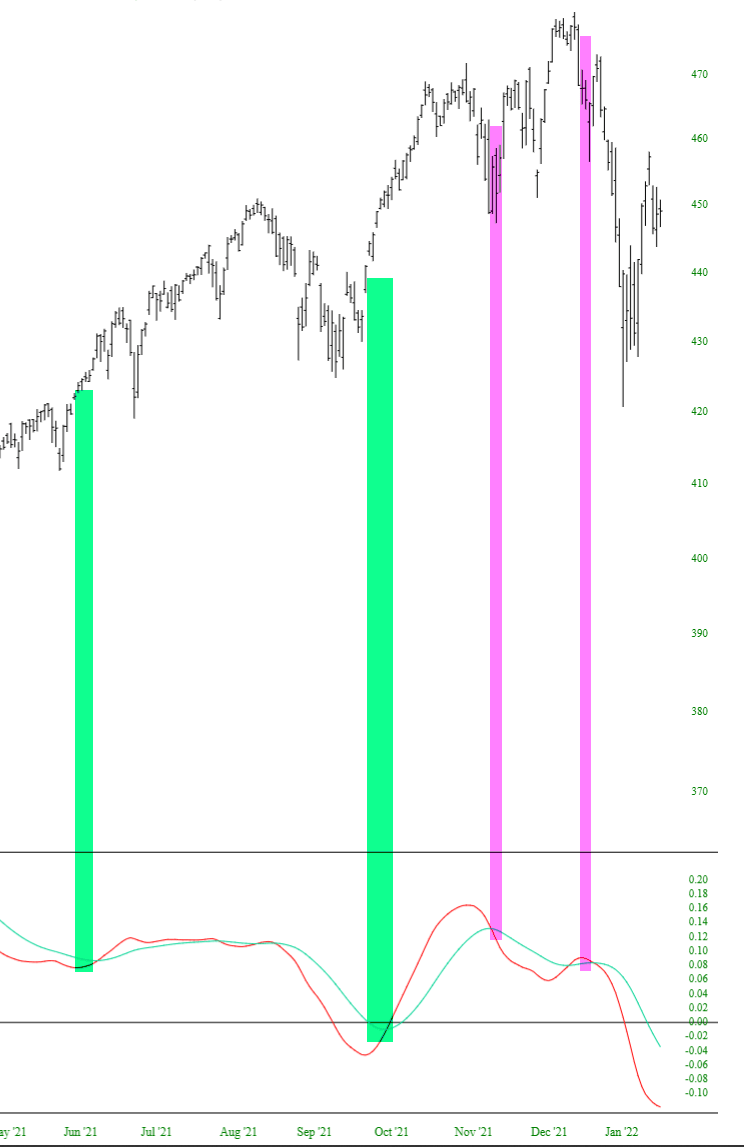
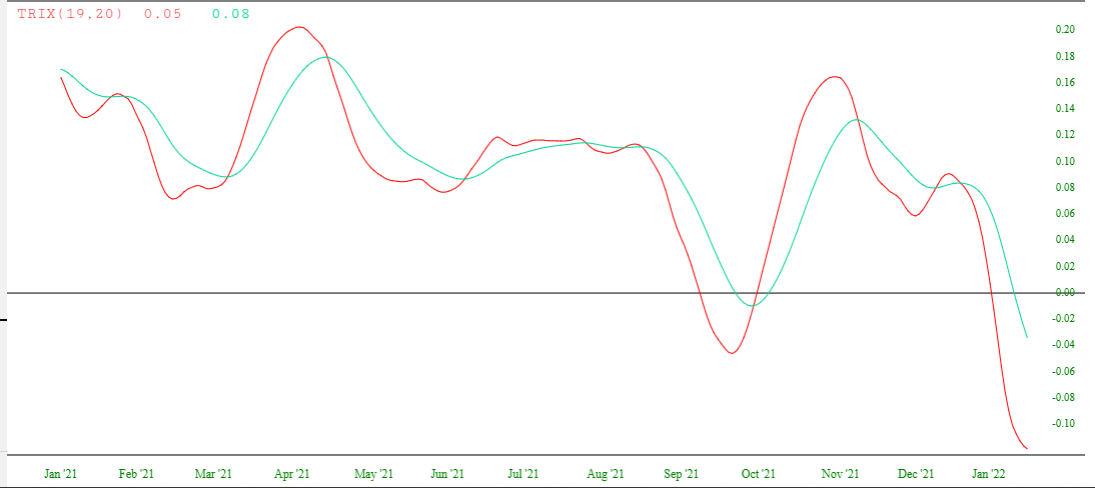
The indicator itself has its own pane, within which are two line charts: one for the TRIX and one for the signal line.
Below is a simple example of the TRIX being used with the SPY. The two green tints show bullish crossovers, each of which produced good buying signals. The two magenta tint show bearish crossovers, the first of which was a false signal, but the second providing a good entry point for a short position.