The True Strength Index was created in 1991 as a means to find market extremes and potential oversold/overbought conditions. It is a double-smoothed indicator, relying on exponential moving average as its foundation. Specifically, its calculation is:

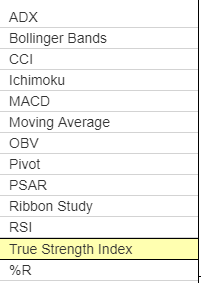
To apply this study, select Technical Studies from the Studies menu, and click the True Strength Index from the pane on the left.
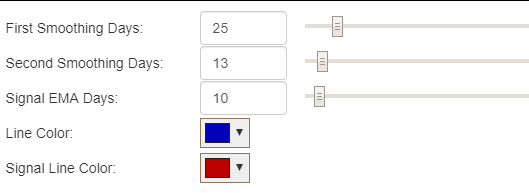
The parameters appear in the technical studies dialog box. You can drag any of the slider bars and immediately see the effect on the study, and you can alter either of the line colors.
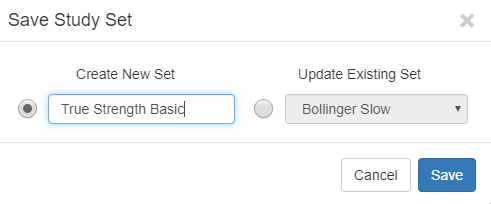
Once you are satisfied with the parameters you have chosen, click the Add button to add this to your study set, and then save it with a name of your choosing.
Now that you are done adding this study to the chart, you can examine its historical relationship with whatever financial instrument you have on the screen.
There are several things you can observe about the TSI:
- Whether it is trending up or down, which also suggests the core trend of the original instrument;
- Instances in which the blue signal line crosses above (bullish) or below (bearish) the red line;
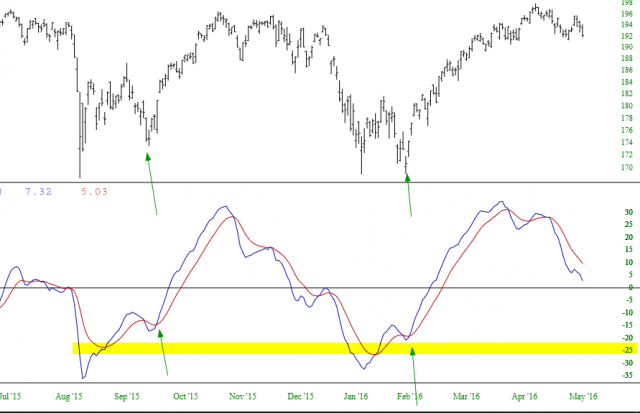
- Whether or not such crossovers are at an extreme level, which typically is -25 (bullish) or +25 (bearish).
Below are a couple of “buy” points for the SPY. In both cases, the TSI was trending higher, the blue line crossed above the red, and the signal happened after the line had already ventured below -25.
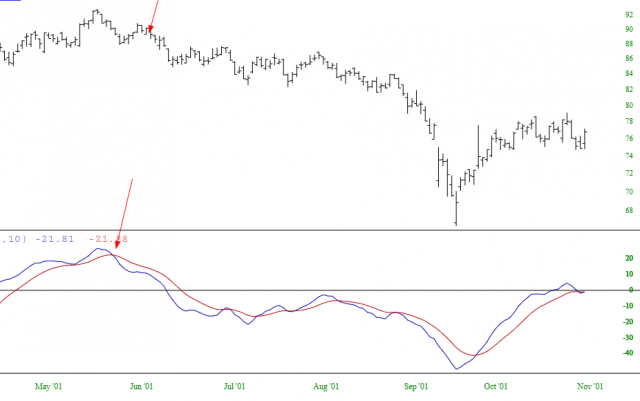
Here is a example of a sell signal, also with the SPY. The blue line crossed beneath the red, the extreme was above +25, and the trend was down. This preceded a tremendous drop in price.