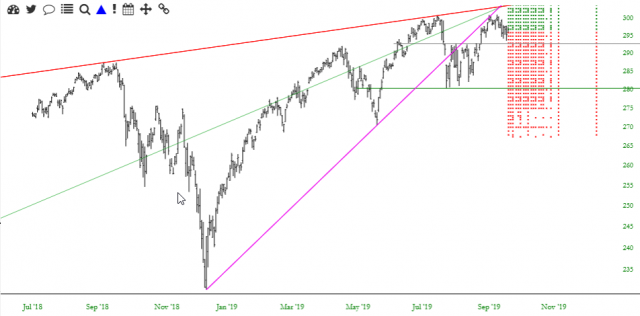
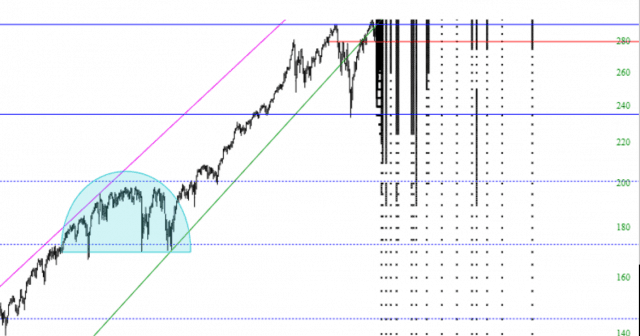
SlopeCharts has a one-of-a-kind way to represent the options contracts that exist for a given financial instrument, and we call them OptionDots. You can watch a video about this feature by clicking here. To use them, just click on the Delta symbol (that is, the triangle) on the row of SlopeLinks:
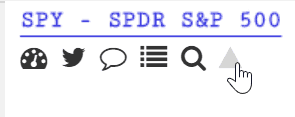
When you do, the color of the triangle will change from black to blue, indicating you are in OptionDots mode. Henceforth, any symbol you look at will show its options (if any) on the chart itself.

Here, for example, is a portion of the SPY chart. Each dot represents a specific strike and expiration. Naturally, there will tend to be far more dots closer to the present time and present price. The farther in-the-money or out-of-the-money you get, or the farther out in time you get, the more sparse the dots become.
As with SlopeCharts in general, you can zoom in to any particular portion of the chart for more detail.
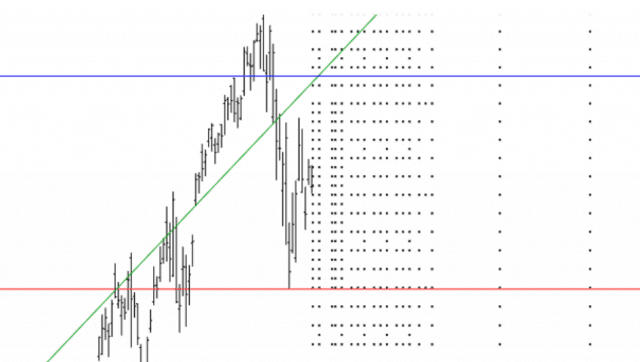
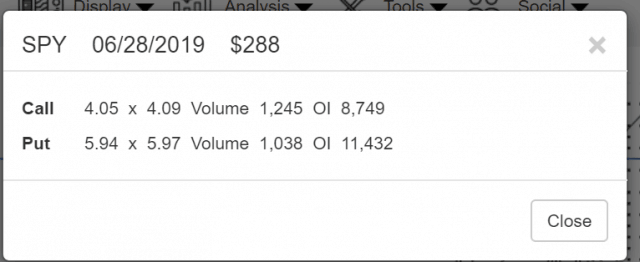
Clicking on any specific dot will bring up the quote for the Call and Put, and the information about the expiration and strike will be shown in the title bar.
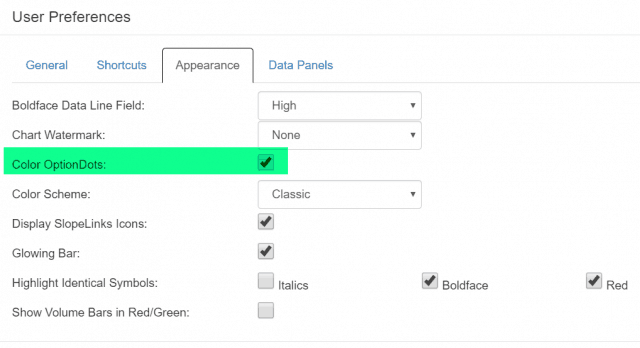
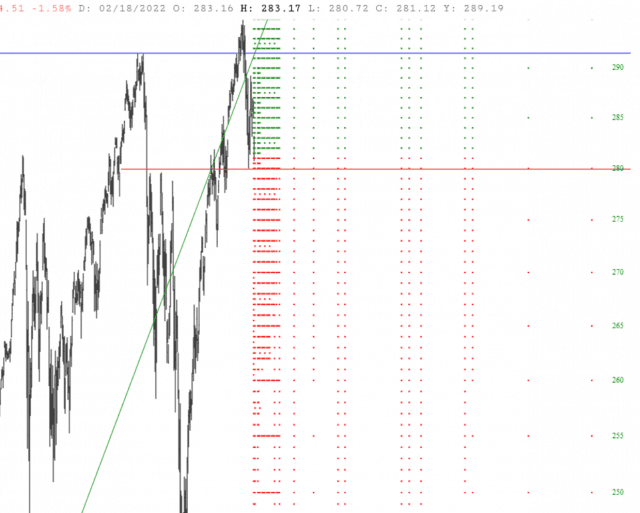
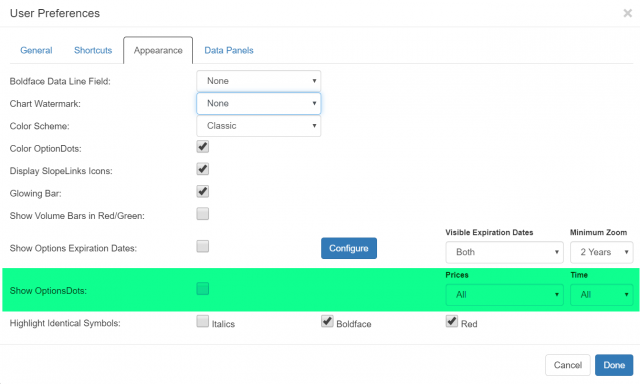
You can control whether the dots are black or in color by way of the Preferences dialog box. If you choose to have the OptionDots in color, the out-of-the-money ones will be red and the in-the-money ones will be green.
Here is what the color dots look like, as opposed to just the black ones shown above.
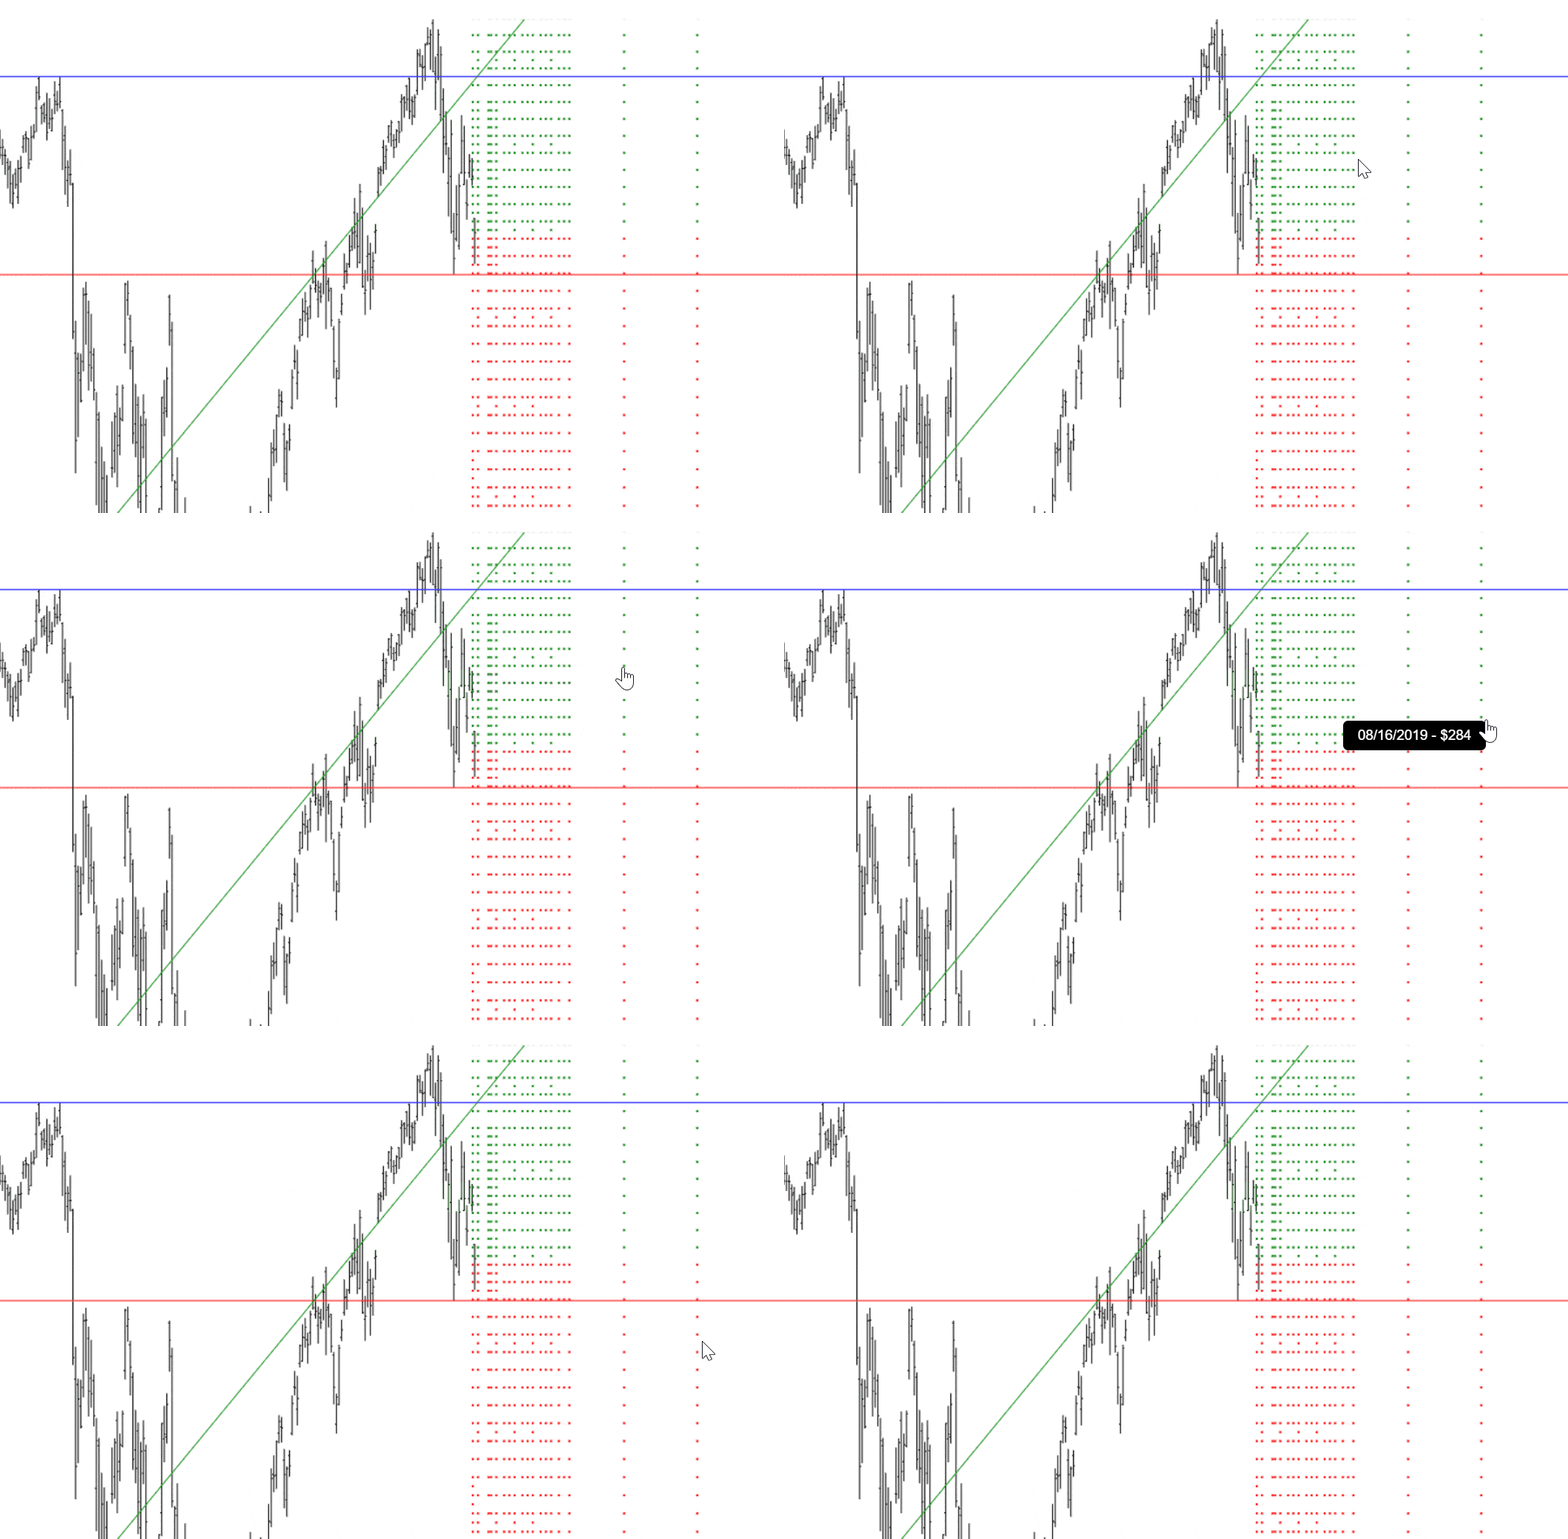
For the sake of convenience and accuracy, when you point at any given dot, the strike price and expiration date of that specific option will be shown. This will save you wasted time, since you want to be sure of the correct choice before you click it to get a quote.
You can also ‘fine-tune’ the behavior of OptionDots with the line tinted below in the Appearance tab of Preferences. There are two relevant dropdowns shown: Prices and Time.
By choosing these, you can control (a) what range of prices is shown, since you may only care about strike prices that are relatively close to the present price; and (b) how far out in time the OptionDots are shown, in case you are not interested in farther-out expiration dates.
By using these filters, you can take an otherwise overly-busy plot of OptionDots……..
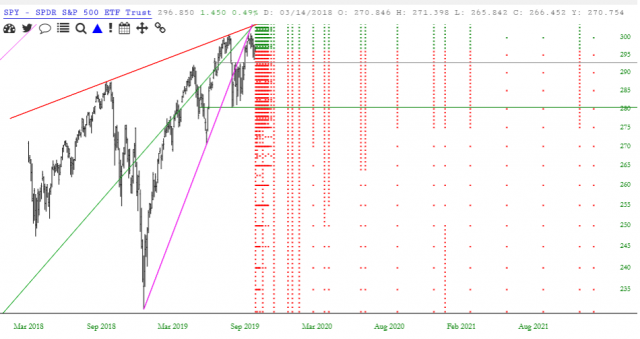
……..and make it far more manageable:
