Something very unusual about the head and shoulders pattern is that it has a doppelganger called the inverted head and shoulders pattern. While the H&S pattern ideally precedes a top, the IH&S precedes a bottom. This bottoming pattern quite literally turns everything about the H&S pattern on its head, since the direction is the opposite but all the other rules are the same.
Definition of the Pattern
The criteria for this pattern are as follows:
- Left Shoulder: a descent in price (perhaps following a long, major drop in the stock’s value), a leveling, and then a strengthening back to a certain support level known as the neckline. The trading volume during this period should ideally increase notably.
- Head: a further descent in price, dropping beneath the low set by the left shoulder, once again leveling off and ascending back to the neckline.
- Right Shoulder: a final descent in price but on lower volume, ideally not going as low as the left shoulder (and certainly not going as low as the head), a leveling off, and a ascent back to the neckline, which it finally breaks above on strong volume.
The target price is the value of the price range of the pattern added to the neckline. For example, if a neckline is at $20, and the bottom of the head is $15, the difference is $5. Therefore, $20 (the neckline) plus the range of $5, equals the target price ($20+$5=$25). This hypothetical setup therefore anticipates a 25% increase in stock price.
Figure IH-1 shows Alcatel-Lucent with a neckline at $2.93 and a bottom at $1.09, implying a target price of $4.77, which is a 63% rise in price. Once the neckline was broken, the price did indeed ascend 69%, slightly surpassing the measured target. In some of these examples, the price ultimately goes much, much higher, but here we are using the highest price it attains prior to a meaningful drop.
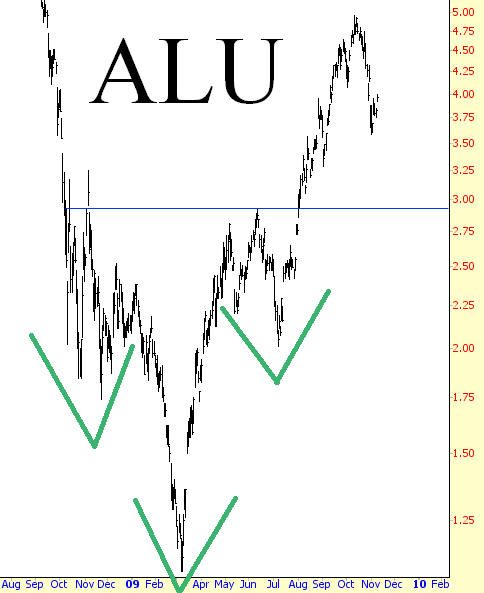
(FIGURE IH-1: The V-shaped lines highlight the three elements of this pattern)
Psychology Behind the Pattern
Let’s re-use the example of IH-1 to explore the psychology behind this pattern. We will put ourselves in the shoes of owners of Alcatel in the summer of 2007. The stock is at about $14.50, and it starts falling. A little more than a year later, which is the left shoulder of this pattern, the stock is down 80% (as a side note, this was an $82 stock in the year 2000, so some poor souls actually were looking at a 96% loss by this point).
ALU falls below $3, then below $2, and tries to find a base. It struggles around the $2 price point into the new year. Long-term owners of the stock are disgusted enough to either throw in the towel or simply hold on, hoping one day to have less severe losses. New buyers enter the picture, thinking that a stock which is 96% cheaper than its peak might be a good gamble. The left shoulder illustrates the struggle between buyers and sellers for find an appropriate price for the stock, now that it has ceased its free-fall.
However, an eight-week span of time from early January to early March sees the stock resuming its free fall, and the only clear floor for the stock which no one questions is $0/share. The stock hits $1.06 on both March 6, 2009 and March 9, 2009, and on March 13, it gaps higher. Between March 6 and May 6, the stock more than doubles in price, providing risk-takers with triple-digit gains (for longer-term holders, such a mover might simply provide a 96% loss instead of a 97% loss). Thus, the plunge from January 8 down to March 6, and its subsequent rise to May 6, creates the head, as the ultimate low for the stock is found and all the selling is exhausted.
The next three months are more discouraging for those who own the stock. With each element of the pattern – the left shoulder, the head, and the right shoulder – we continue to see these brief periods of equilibrium where the stock isn’t moving dramatically higher or lower, but is instead “churning” between buyers and sellers. Even though ALU manages to get as high as $2.93 on June 11, it loses its footing, and it drops about one-third of its value.
Between July 8 and July 31, the stock fights its way back to the neckline and, finally, on August 3, it gaps above the neckline on volume which is about 65% higher than the prior day’s, completing the pattern and providing a target. This entire process has “cleared out” the selling pressure, established some very happy new buyers, and finally launched the stock into a meaningful recovery.
As an interesting side note, this exact same scenario with the same pattern played out years earlier, between July 2002 and January 2003, with Alcatel. And, as with 2002-2003, the inverted H&S pattern of 2008-2009 preceded a hearty recovery only to see the stock stumble later to newfound weakness down the road.
The Importance of the Neckline
As with the H&S pattern, the neckline defines whether or not the pattern is complete and, therefore, has any meaning. As with other lines in technical analysis, the neckline represents a “line in the sand” dividing bulls and bears. Along the line itself is a sort of equilibrium between buyers and sellers. Trading above the line represents strength and hope. Trading beneath the line represents weakness and fear.
With an ideal H&S pattern, the neckline has five unique “touch points.” The first is on the left side of the left shoulder; the second is at the right side of the left shoulder (which is also the left side of the head); the third is at the right side of the head; the fourth is at the right side of the right shoulder, at which point the price breaks beneath the neckline; and the fifth point (which is optional, in a sense) is when the price retraces back up to the neckline before falling hard once again.
Ideally, the neckline should be horizontal, since price equilibrium should concentrate in a tight, consistent price range. You may allow some leeway for a tilted neckline, however, perhaps as much as ten degrees either upward- or downward-sloping. Those newer to charting often look at any trio of price humps and assume they’ve discovered an H&S pattern, no matter how distorted the pattern or how sharping-ascending the neckline. The higher-quality the pattern, the more reliable it is as a predictive guide.
Once the price has broken above the neckline, the pattern has validity only if the price remains above the neckline. (If the price retraces, you may want to allow for a few pennies of “violation” before dismissing the pattern altogether). Just because the price goes below the neckline doesn’t absolutely mean the stock will not rise, but it does indicate weakness that is normally not a part of a good, strong breakout. A pattern with “noise” such as this should be viewed with more skepticism than a pattern absent such noise.
Let’s examine some examples of this important reversal pattern.
Example: Newport Corporation
Newport, shown in IH-2, is an exceptionally good example of an inverted head and shoulders pattern. It features very well-defined components, a right shoulder higher than its left, an extremely clean neckline, and a retracement on November 30 which was an ideal low-risk entry point for a long position.
The retracement is of particular interest here, because it took a full four months from the initial breakout for the stock to retrace. This shows that you don’t always have to be watching every tick of a stock price to get into a good opportunity. There was ample opportunity to discover this pattern, determine the neckline, get into the position, and know the appropriate level for your stop-loss order. Those entering thetrade soon after the neckline might have found themselves frustrated at the meandering behavior of the price, particularly as it threatened the neckline. All buyers, however, were rewarded in the end, since the stock more than doubled in price from its breakout point.
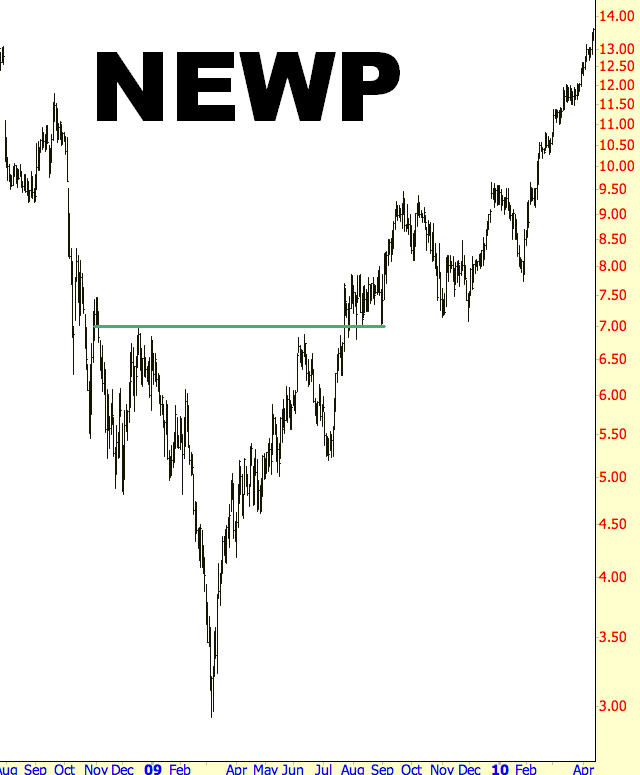
(FIGURE IH-2: Newport more than doubled after pushing above $6.80)
Neckline: $6.80
Pattern Bottom: $2.93
Target Price: $10.67
Target in Percentage Change: 57%
Actual Percentage Change: 113%
Example: Mylan
Mylan Labs, shown in IH-3, is one of the “uglier” examples, since its left shoulder isn’t terribly clean and doesn’t even reach the neckline. However, a right shoulder substantially higher than the left only amplifies the possibility that the stock is gaining strength, and an upward-tilting neckline is acceptable.
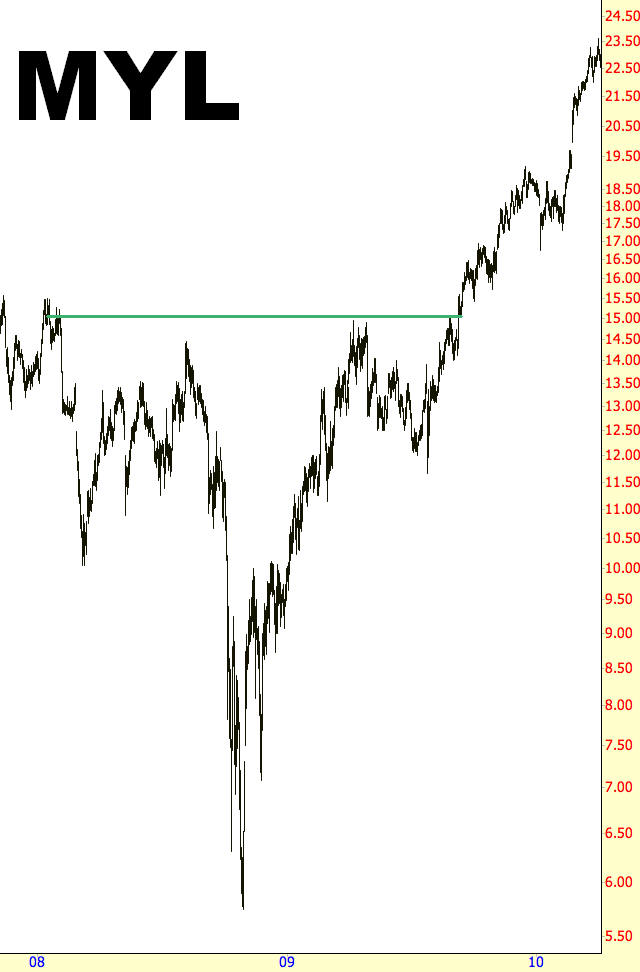
(FIGURE IH-3: It’s always better to have a right shoulder whose base is higher than the left’s)
Neckline: $14.94
Pattern Bottom: $5.75
Target Price: $24.13
Target in Percentage Change: 62%
Actual Percentage Change: 58%
Example: Mattson Technology
Here again, in IH-4, we have a nice example of a retracement. Keep in mind that these are not guaranteed to take place. Some breakouts never look back, whereas others give people a second opportunity (and sometimes even a third) to get on board the long position. The breakout took place on September 4 and, almost exactly two months later on November 3, the stock had retraced back to its neckline after a 65% run-up in price. You can appreciate how it would be more comfortable getting into the stock back at its neckline without having to pay this 65% premium, even though all buyers were eventually rewarded with a 192% gain.
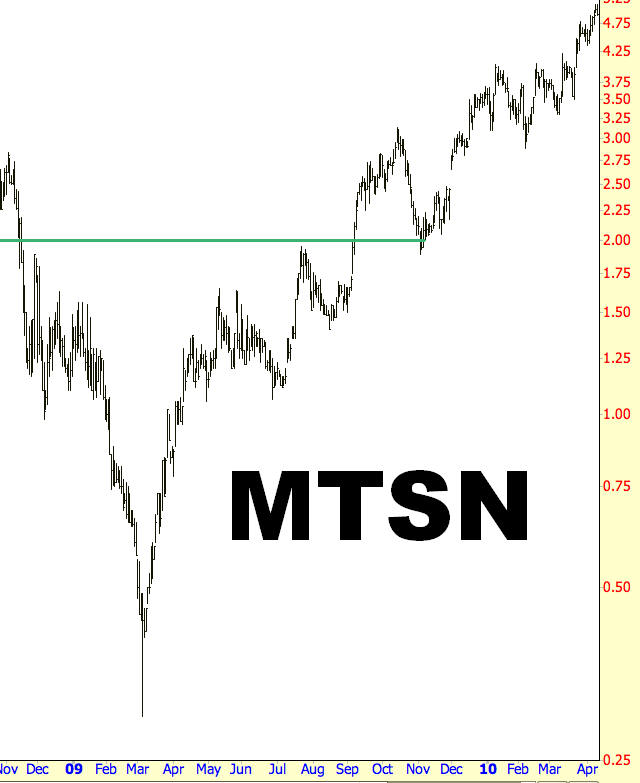
(FIGURE IH-4: This retracement encroached slightly on the neckline, but a little leeway would have allowed the position to stay in place)
Neckline: $1.89
Pattern Bottom: $0.30
Target Price: $3.48
Target in Percentage Change: 84%
Actual Percentage Change: 192%
Example: Brigham Exploration
Although it is safer to wait for a retracement before entering into a position, it may also foreclose you from getting into a position at all, should the retracement never take place. Examine the breakout in IH-5, which began with a strong volume day on July 27, 2009. The stock gained 70% in just a couple of weeks, paused briefly, and then continued the climb. No serious pause took place until Brigham had soared over 350%. One risk-reducing strategy that still avails you to such runaway moves is to enter half your intended position at the breakout and the other half at the retracement (should one occur). This way, even if the price never gives you another opportunity to get it near the neckline price, you at least will have some profit to show for your efforts.
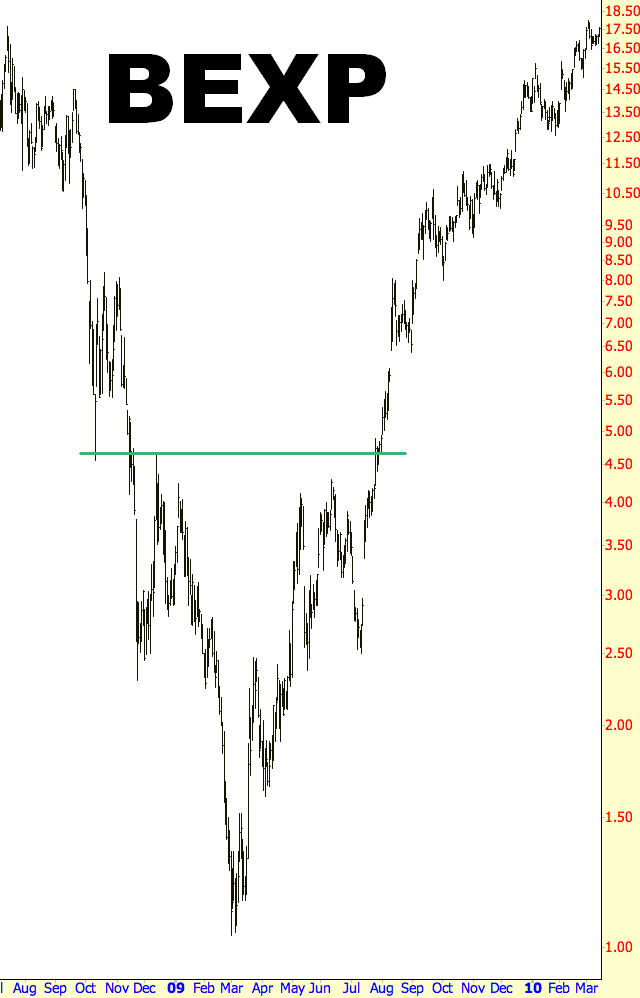
(FIGURE IH-5: Some breakouts are more powerful than others, and this was a particularly strong one, pushing the stock into triple-digit gains within just a few months)
Neckline: $4.68
Pattern Bottom: $1.04
Target Price: $8.32
Target in Percentage Change: 78%
Actual Percentage Change: 352%
Example: Masco
Sometimes a stock’s retracement will take it a little underneath the neckline. If your stop-loss is too loose, you run the risk of letting a profitable position turn into a loss (or, even worse, subjecting yourself to a gap-down in price, resulting in a substantial loss). On the other hand, if your stop is too tight, you run the risk of blowing yourself out of a position just because of a very minor pattern violation and then missing out on what, in the end, turned out to be a very good trade.
An example of this latter possibility is shown in Figure IH-6, in which the price dipped just a few pennies beneath the neckline on November 7th. It is impossible to know at the time, of course, whether this violation of the neckline is a warning that the pattern is invalid, and that much lower prices are forthcoming. After all, those who based their purchase on this bottoming pattern will be eager to get out, and prudent traders with stop-losses in place at the neckline will flood the market with sell orders.
There is no hard-and-fast rule for this situation. If you tend to be more conservative, you may want to play things strictly “by the book” and have the stop-loss set precisely one penny below the neckline. On the other hand, if you’d rather give the stock permission to dip beneath its neckline by some amount you consider reasonable (1%, 2%, or whatever figure is comfortable for you), you will reduce your chances of getting unnecessarily stopped-out but, at the same time, open up the possibility that you are being too liberal with the chart and could experience losses that could otherwise have easily been avoided.
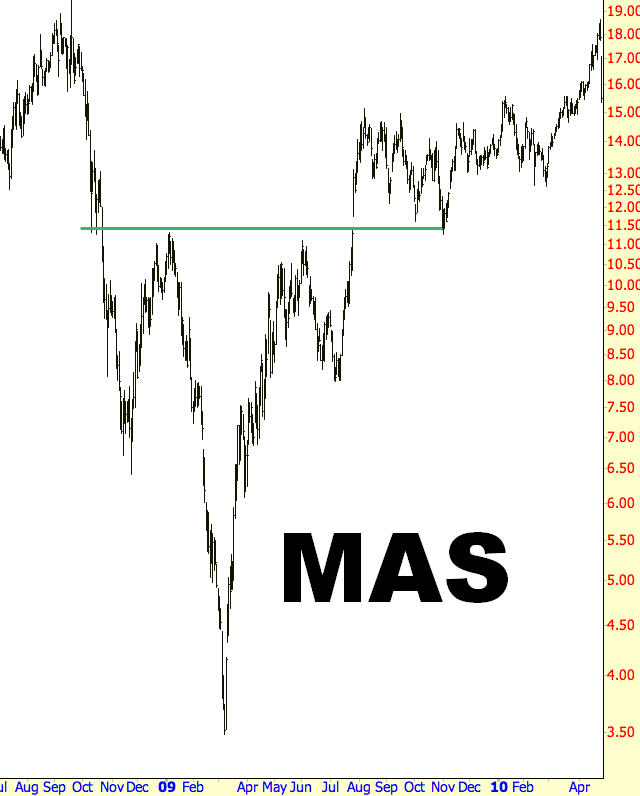
(FIGURE IH-6: The anticipated rise for this pattern, 69%, was almost perfectly nailed with a 66% ascent in value)
Neckline: $11.11
Pattern Bottom: $3.45
Target Price: $18.77
Target in Percentage Change: 69%
Actual Percentage Change: 66%
Example: Ship Finance International
One of the most remarkable examples of the H&S pattern in action in the U.S. stock market in recent What happened following this breakdown was extraordinary. From November 7, 2000 through April 4, 2001, Broadcom lost about 90% of its value, all in a span of about five months. And it did so on extremely high volume. The H&S pattern, in spite of its false start, provided an astonishingly prescient prediction of this stock’s direction (Figure IH-7).
After the stock reached its bottom on April 4, 2000, it spent about the next fourteen months bouncing in a huge trading range between $12 and $36. Clearly the investing public had been caught in a horrible tailspin and was trying to establish an appropriate value for the stock. After all this churning, the stock starting losing support again, and it ultimately bottomed at a little over $6 (a little over 3% of its peak price) in October of 2002.
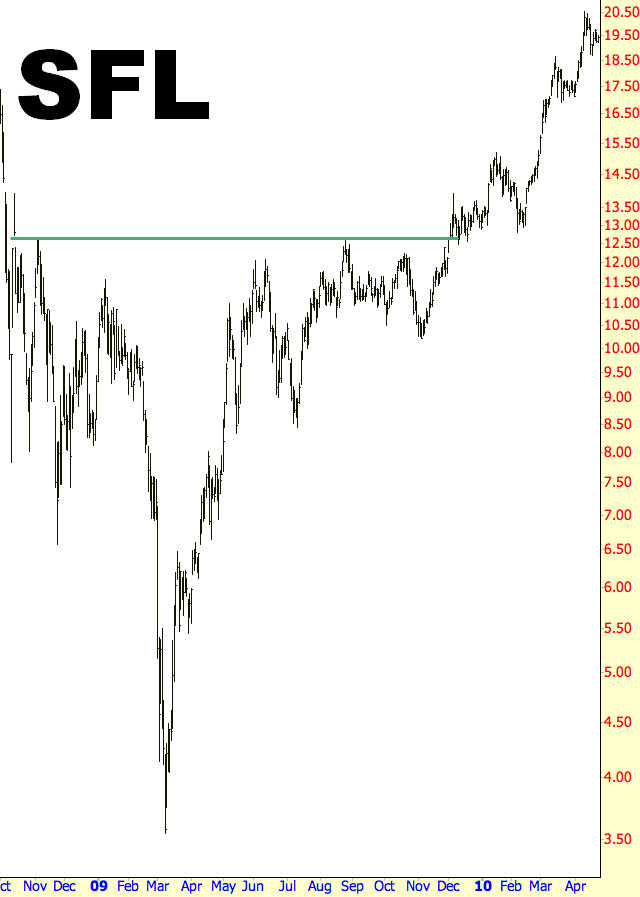
(FIGURE IH-7: Past research in technical analysis suggests that “tall” formations such as this are more reliable than wide, shallow ones)
Neckline: $12.60
Pattern Bottom: $3.49
Target Price: $21.71
Target in Percentage Change: 72%
Actual Percentage Change: 83%
Example: Polyone
Typically the stocks which make the most dramatic percentage moves are lower-priced instruments. After all, if a stock like Google, at $600 per share, has surprisingly good news, it might move the stock up 5% or 10%, but you are unlikely to find that, a year later, GOOG is trading for $3,000 per share. An inexpensive stock, however, being especially attractive to a large number of retail traders, can offer far more substantial percentage rewards (and, naturally, risks).
Ticker symbol POL, whose chart is in IH-8, hammered out a bottom between November 2008 and July of 2009. Even after more than doubling in price from its spring bottom, the stock was still only about $3.50 per share and, importantly, its volume picked up noticeably in its early July price breakout. The stock had a projected move of 63%, but it actually wound up soaring 231% before settling back (it went on, months later, to even more significant gains).
This may beg the question: does one dump out of a position the moment the price objective is met? For conservative traders, the answer would be yes. If you are more aggressive (or greedy), there are a couple of techniques you might employ. One would be simply to keep your stop-loss price tight and, if you are fortunate enough for the stock to keep pushing higher, so be it – – – because your entry point is so far away, there is virtually no chance that the trade will result in anything but a profit, no matter what. Another method would be to sell half the position once your profit target is met and, as before, simply keep your stop-loss price fresh and up-to-date for the remaining portion, perhaps padding your already handsome gains.
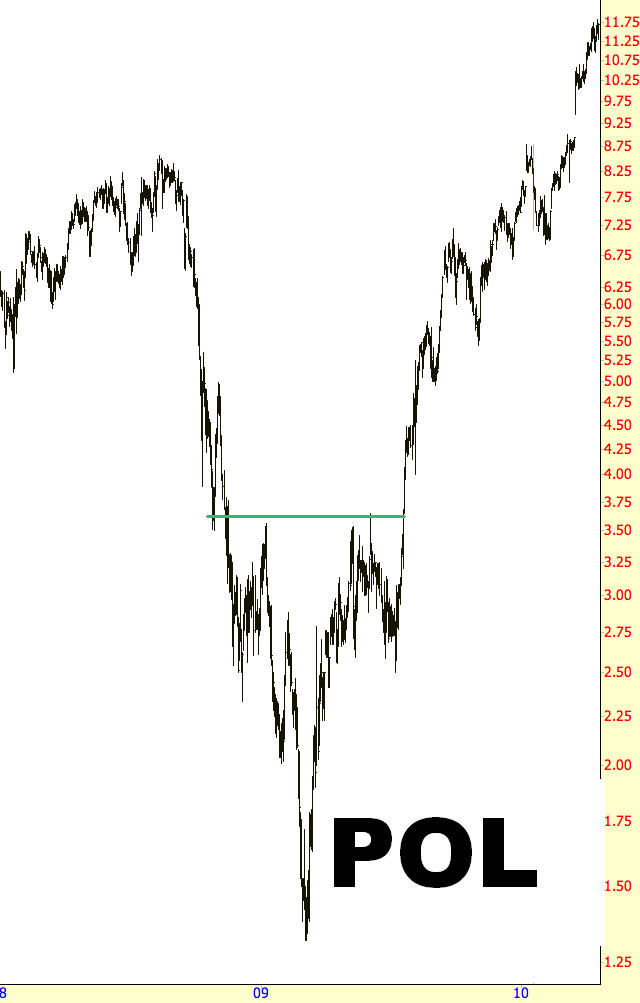
(FIGURE IH-8: The move for this stock was not only powerful but long-lasting, resulting in a several-fold increase in value)
Neckline: $3.56
Pattern Bottom: $1.32
Target Price: $5.8
Target in Percentage Change: 63%
Actual Percentage Change: 231%
Example: SM Energy Company
The chart in IH-9 is perhaps the cleanest example of a retracement among any of those shown in this chapter. The neckline, at $24.43, is pierced on August 3, 2009. The stock pushes up for a couple of weeks and then, having lost the initial strength from breakout buyers, sinks softly for another couple of weeks, finding a low at $25.07, only about half a dollar higher than the neckline. Chartists watching SM at this time would have been wise to jump on board, because the risk of loss was modest.
For instance, if the most conservative of traders had bought the stock at $25.10 and had placed their stop-loss just beneath the neckline at $24.42, their risk is less than 3%. The pattern is already very clean, the breakout took the stock up about 15% in price, and the stock is actively traded in the millions of shares each day. A purchase around this area would have had an excellent risk/reward ratio, and owners were rewarded with a doubling of the stock’s price by June of the following year.
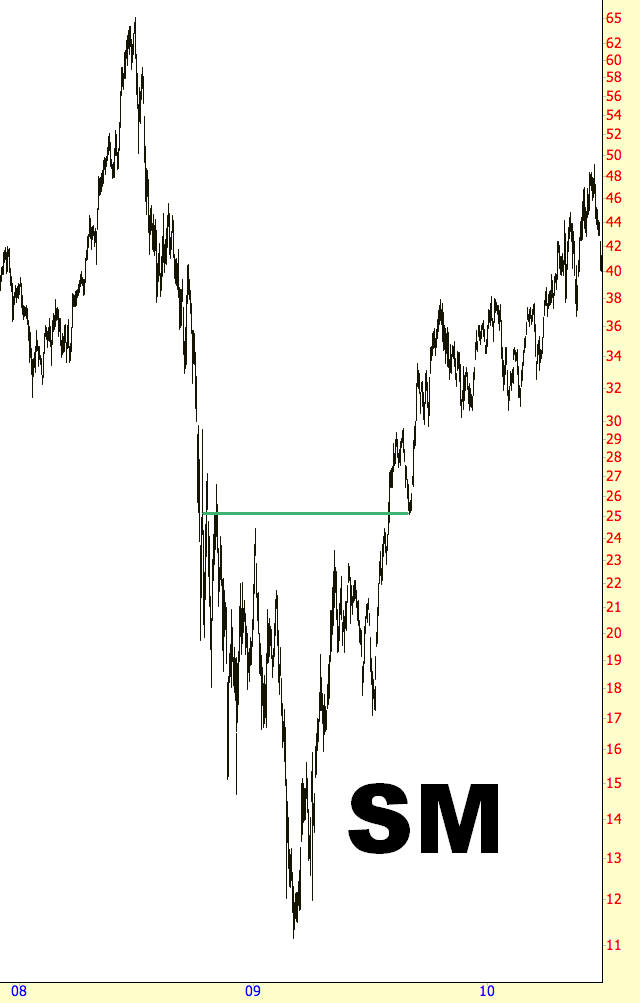
(FIGURE IH-9: Here is a textbook-perfect example of a retracement hitting the neckline)
Neckline: $24.43
Pattern Bottom: $11.13
Target Price: $37.73
Target in Percentage Change: 54%
Actual Percentage Change: 101%
Example: Industrial Sector ETF
The historic example provider in IH-10 doesn’t have the gigantic gains of some of the other examples, because it is an ETF comprised of many individual securities. The gain is still handsome, however, at 40% within a period of about nine months, and it illustrates that there are opportunities to be had with non-traditional instruments such as ETFs along with common stocks. There is no reason not to examine popular ETFs on a regular basis for instances of such patterns, since they are typically highly-liquid, have narrow bid/ask spreads, and lack the “surprise element” that common stocks have. (In other words, you will not be shocked one morning to find a highly diverse ETF has suddenly lost half of its value due to terrible earnings news).
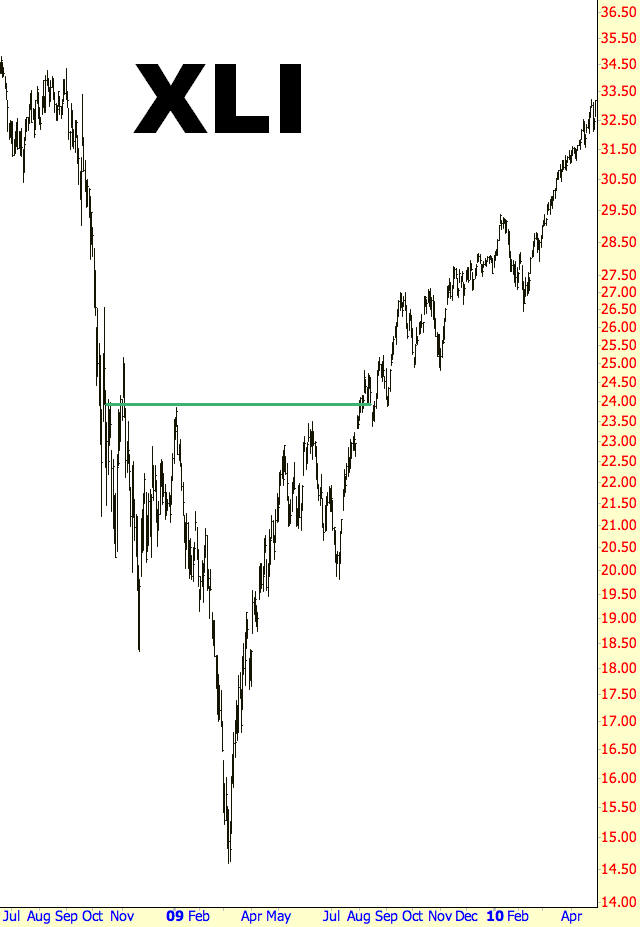
(FIGURE IH-10: This upswing had a few meaningful dips along the way, but nothing substantial enough to break the general up-trend in price that was in place for over a year)
Neckline: $23.62
Pattern Bottom: $14.45
Target Price: $32.79
Target in Percentage Change: 39%
Actual Percentage Change: 40%
Summary
The inverted head and shoulders pattern is one of the easiest patterns to identify and exploit, because the parameters for the trade are so clean. Pay close attention to the volume, particularly during the breakout, since you want to see a lot of strong buying interest once the neckline is breached. As always, take care not to jump into the security before the neckline is actually overcome, because the stock market is packed with instances of patterns that are 95% complete before they simply roll over and fail to fully blossom.
