Average Directional Index (ADX) is a technical analysis indicator that represents the strength of a trend. In spite of the word “directional” in its name, the ADX is different from most technical analysis indicators. It is important to recognize that Average Directional Index is not an indicator of the direction.
As the ADX increases, that means that the trend is becoming stronger. In other words, the ADX could be moving higher and higher while prices are moving lower and lower, and all the ADX is telling you is that the trend is strong and getting stronger. The fact ADX is going “up” doesn’t mean prices are doing the same thing.
The trend of a security can be going either up or down at any time. Each direction is shown with a positive or negative directional indicator, +DI for positive and -DI for negative. When representing Average Directional Index on a technical analysis graph, it is common to use all three lines.
The strength of a trend is a useful piece of information for determining if a trade should be entered as a long or short position, or if a trade should be taken at all.
Interpreting and Understanding Average Directional Index
ADX is used to indicate the gaining or losing of momentum for a trend. It is important to remember that ADX is not directional. You can have a high ADX as the security’s price drops. Also, while the ADX and its associated chart line may be decreasing, it doesn’t necessarily mean that the trend is reversing. It simply means that the trend’s strength is weakening.
Calculating ADX requires a detailed formula, but thankfully it is handled by SlopeCharts automatically. In general, ADX calculations are based on the moving average of price range expansion over 14 days, but other lengths of time can be used.
ADX is represented on a scale of 0-100. According to Welles Wilder, the developer of the indicator, a trend has strength when the ADX is above 25. In contrast, the price is trendless or has a weak trend when the ADX is below 20.
ADX is often used with the -DI and +DI to help determine trend direction and a stock’s momentum. Some traders look for signals to enter or exit a position when there is a crossover between the +DI and -DI, then they use the strength of the ADX to determine if the trend will continue in that direction. The strength of the Average Directional Index is a way to filter out signal noise that can occur from a security that has frequent crossovers.
How to use ADX in SlopeCharts
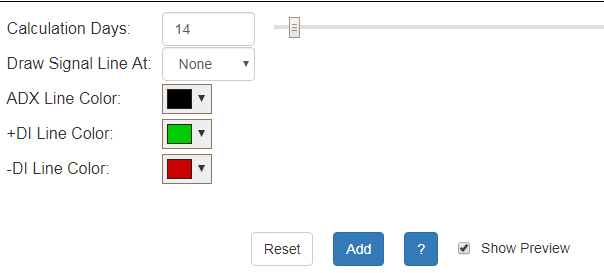
The ADX, like all technical studies, is accessed via the SlopeCharts Technical Studies dialog box, which you get to from the Studies menu. In the ADX tab are these controls:
Calculation Days is a slider bar that can be moved left (fewer days) or right (more days). It has a default of 14, which is considered the standard for the study.
Draw Signal Line At is a dropdown which lets you control if a horizontal line is displayed. ADX users typically like a line at either 20 or 25 to make it easy to see whether or not the ADX line is above such a level (if it is, the trend is considered strong).
Finally, you can change the colors for the Average Directional Index (ADX), Minus Directional Indicator (-DI) or the Plus Directional Indicator (+DI).

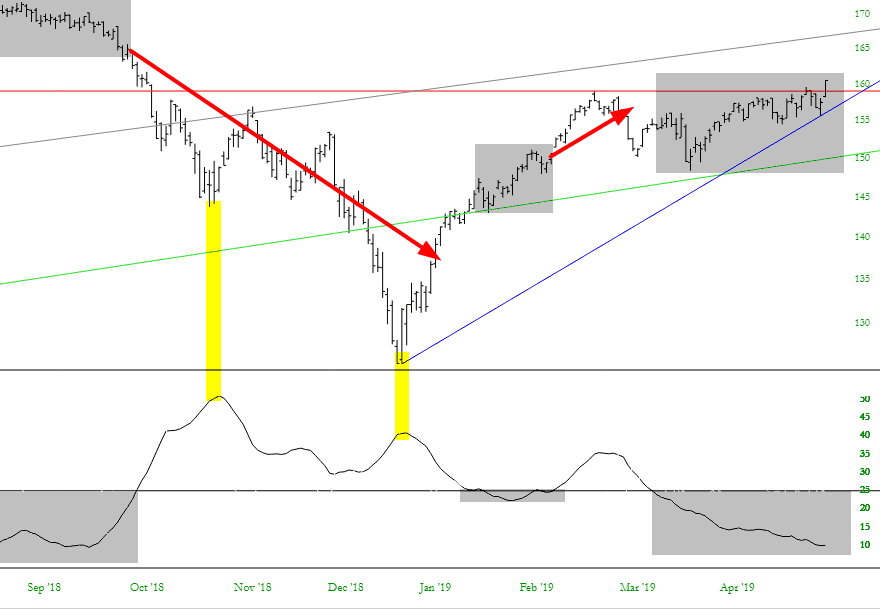
Below is an example of the ADX, in this instance being used with symbol IWM. The grey area denote portions when the ADX was below 25 (marked on both the ADX pane and the price pane for clarity). These are areas where prices tend to be “range-bound’ and not trending strongly.
The places in which there is no tint indicates an ADX above 25, suggesting a strong trend. Again, take note that the major “trend” on the left side of the chart was downward, and the ADX’s upward movement simply was affirming the strength, not the direction, of the trend. The yellow tints merely indicate points at which the ADX pivoted lower, suggesting a diminishment of trend strength, even though it remained above the 25 level.
Another example can be seen with the oil and gas exploration fund symbol XOP. Much of the chart meanders higher and lower within a range, and the ADX (greyed out) is persistently beneath the 25 level. The left portion of the chart, however, did have a strong trend (which was driving prices lower).

To see what Slopers in the comments section have been saying about the Average Directional Index indicator, check out the archives located here.
