The Average True Range (ATR) is a technical analysis indicator that measures market volatility by decomposing the entire range of an asset price for that period.
What Is The Average True Range Indicator?
The Average True Range (ATR) was developed by Welles Wilder and is a technical trading indicator that determines volatility by measuring the magnitude of price movement over a period of time. The ATR is a moving average of the true ranges for a security, typically over a 14-day period. The first step in calculating ATR is to find a series of true range values for a security.
The reason for this is the calculation for Average True Range is based on its dollar price range (either the difference between a day’s high and low or, when appropriate, the difference between the day’s high and prior close or the day’s low and prior close). The average of these values is the basis for the line chart drawn. The default value of 14 days is the suggested value of the original creator of the study, Welles Wilder, but traders can use shorter periods to adjust for the frequency and probability of trading signals.
How To Use The ATR Indicator?
The Average True Range (ATR) is used to interpret the current volatility of a stock or market by measuring the magnitude of price movement. Unlike some indicators, its ascent and descent have nothing to do with strengthening or weakening prices, but instead illustrates volatility.
Simply put, a security that is currently experiencing a high level of volatility will have a higher ATR, and a security with low volatility will have a lower ATR.
ATR has a few different uses by technical traders, including as a timing indicator for when to enter and exit trades or as a tool for identifying how to size a trade.
SlopeCharts Average True Range Guide
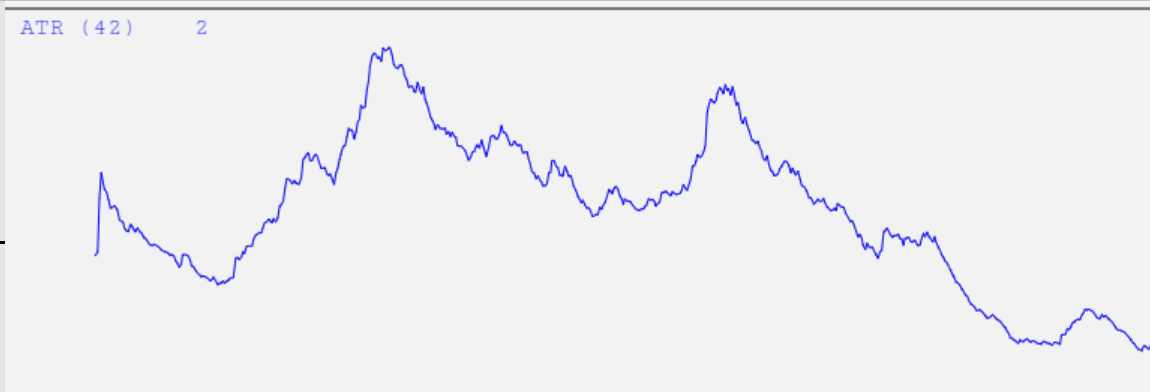
The average true range (ATR) indicator appears in a pane of its own and indicates increasing or decreasing dynamism in a security’s price.
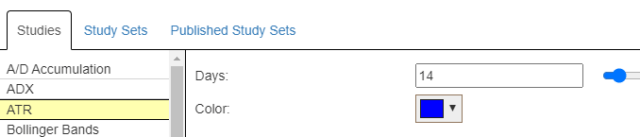
You will find this study in the Technical Studies dialog box, and it has two parameters: the number of days used in the calculation (which you can manually enter or adjust via the slider bar) and the color.
If you use the slider bar, you can witness how different day settings affect the resulting chart.
Below is one interesting example of the Average True Range with SPY. The trendline in the ATR window had been declining for years. When the ATR finally pushed through the descending trendline (marked below with a vertical line), the market began a severe downward move.
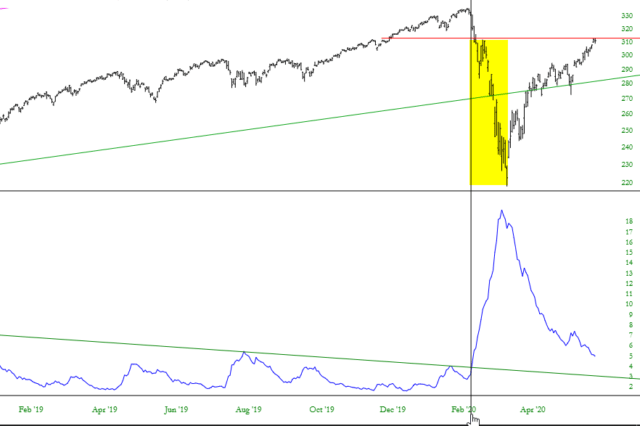
Again, it was not the direction that was important (since this does correspond to the prospect of prices going up or down), but the fact that the ATR broke its downtrend that suggested an important change in volatility was happening.
To see what Slopers in the comments section have been saying about Average True Range, check out the archives located here.
