The Balance of Power indicator illustrates buying and selling pressure on a given financial instrument. On a day to day basis, it can range from -1 to +1. If, for example, a stock opened at precisely its low point of the day and closed at precisely its high point of the day, the figure would be +1, since the buyers were fully in control. On the other hand, if a stock opened at exactly its high point for the day and closed at precisely its low point for the day, it would be -1. In almost all cases, the daily figure is between these extremes, and the indicator is a moving average of those figures. The number of days used is, by default, 14, although you can change this to any value you want.
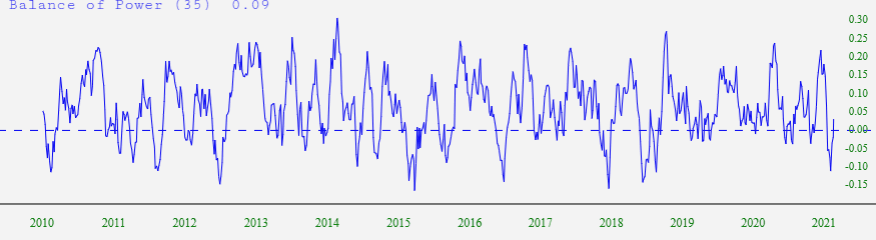
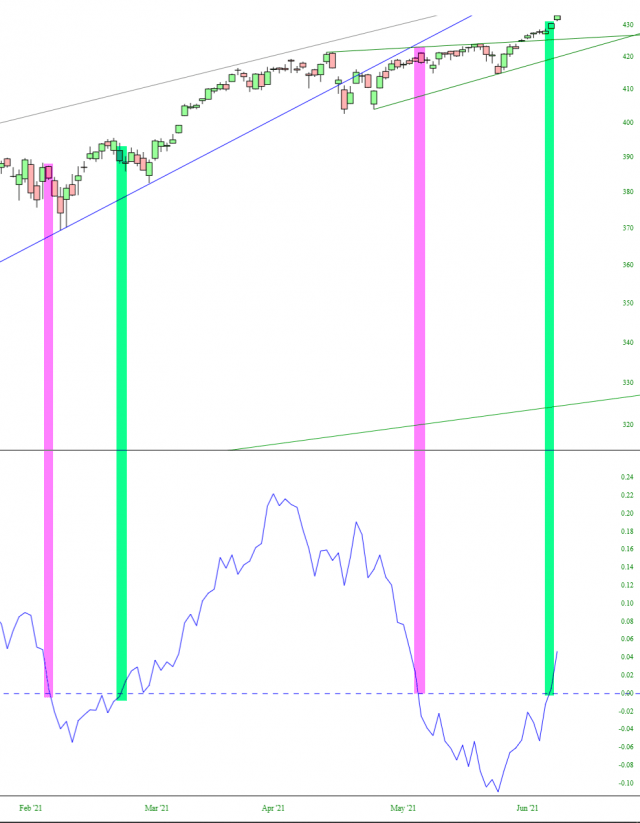
Shorter time periods will, naturally, produce a very volatile indicator. Below is a 36-day indicator against the SPY. The crossing of the 0.00 line is highlighted below, with negative crossovers in magenta and positive crossovers in green. These events are indicative of a shift in power between buyers or sellers.
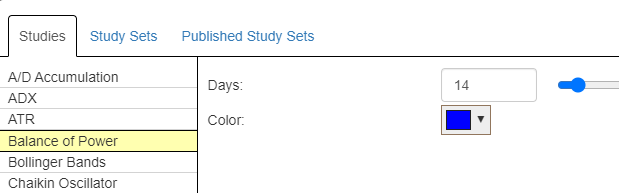
You can experiment with different days to use for the BOP indicator by dragging the slider bar left and right in the Technical Studies dialog box so you can assess where important past moves have been telegraphed by signals from the indicator itself.