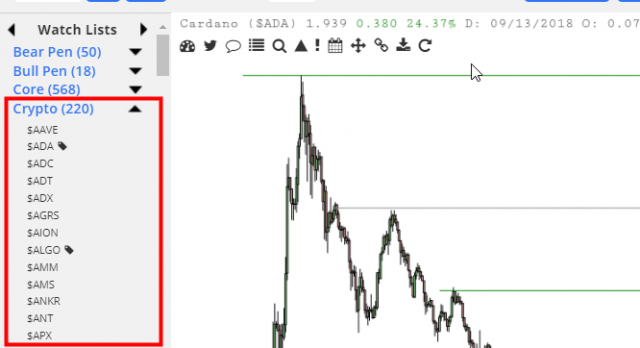
There are hundreds of live cryptocurrency charts in SlopeCharts, immediately ready for your study. All you need to do is enter the dollar sign followed by its ticker symbol (for example $BTC for Bitcoin, $ETH for Ethereum, and so on).
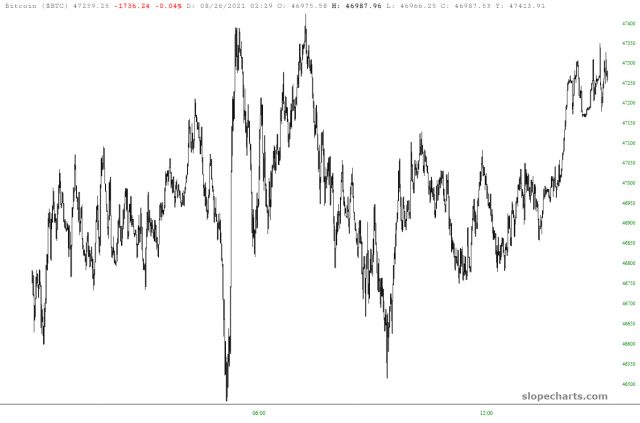
One thing you’ll notice about the crypto charts on Slope is how clean they are and how far back in time they go. They are also available on both a daily basis as well as intraday. In fact, most other services have no intraday charts, and if they do, the might have one day’s worth of data. SlopeCharts has literally months of minute bar data on hand, which is an important perspective. Here is a detailed few of minute bars covering just one session:
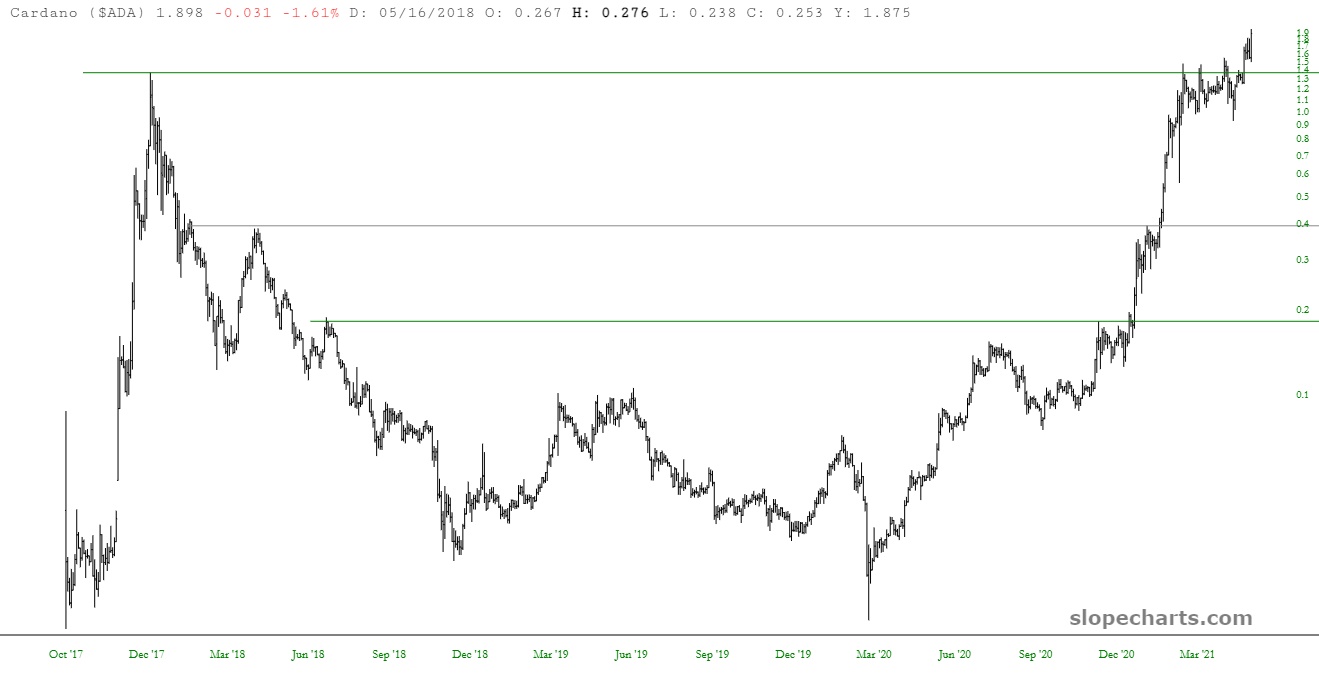
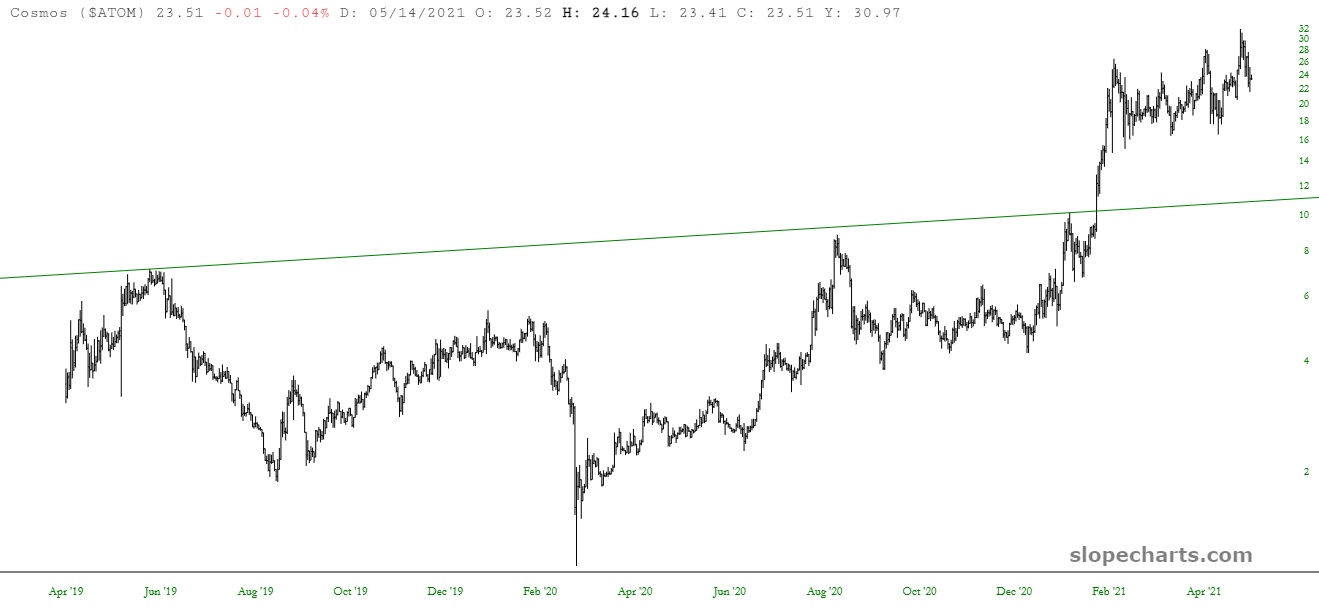
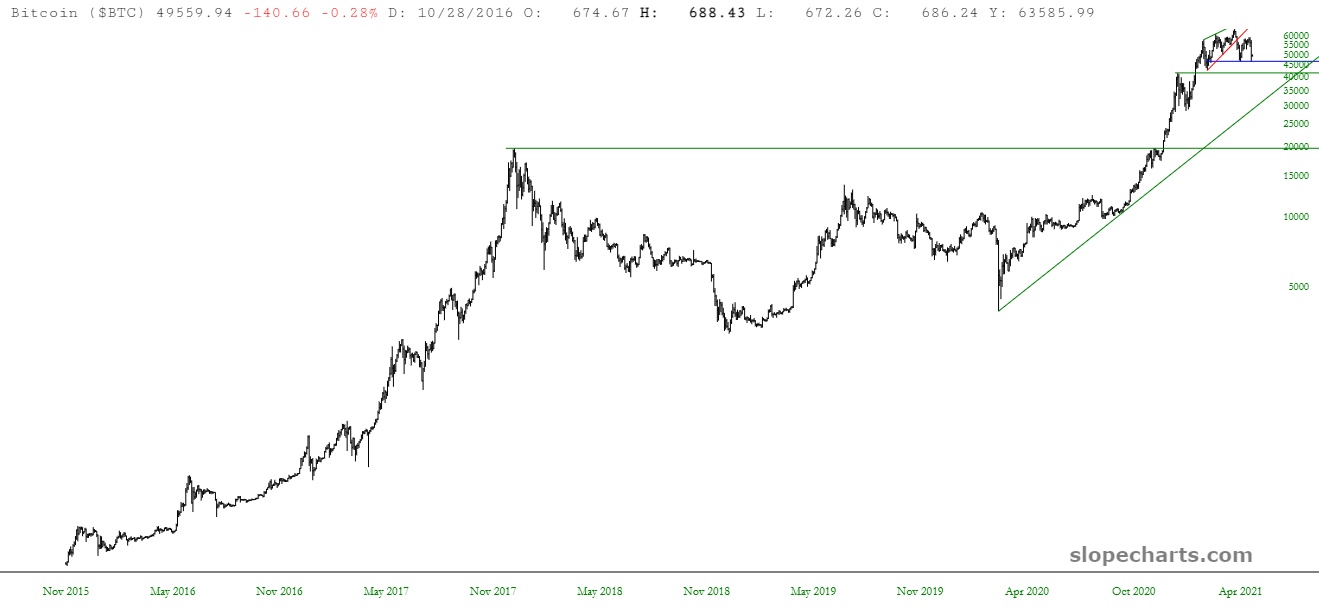
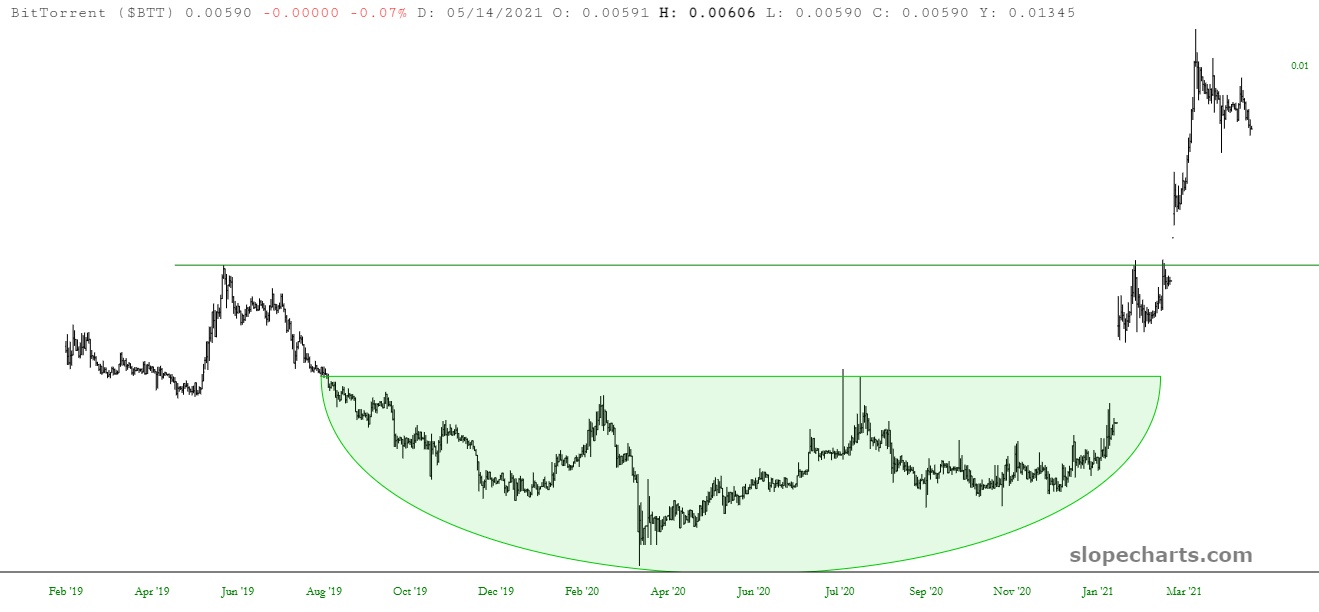
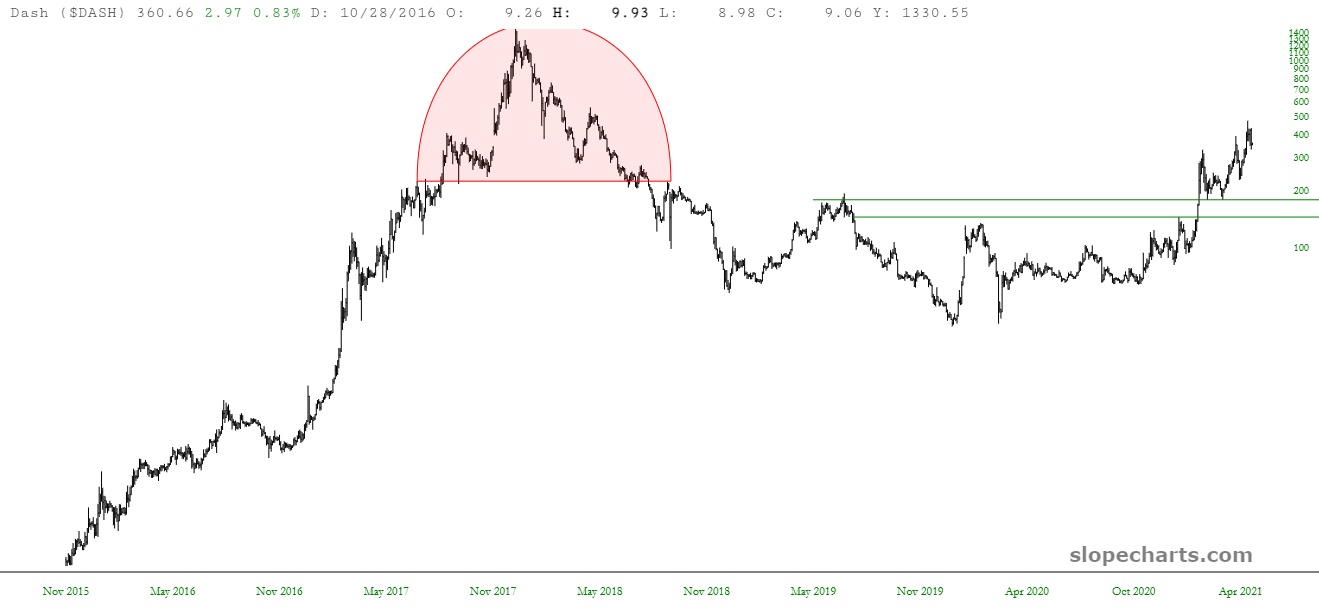
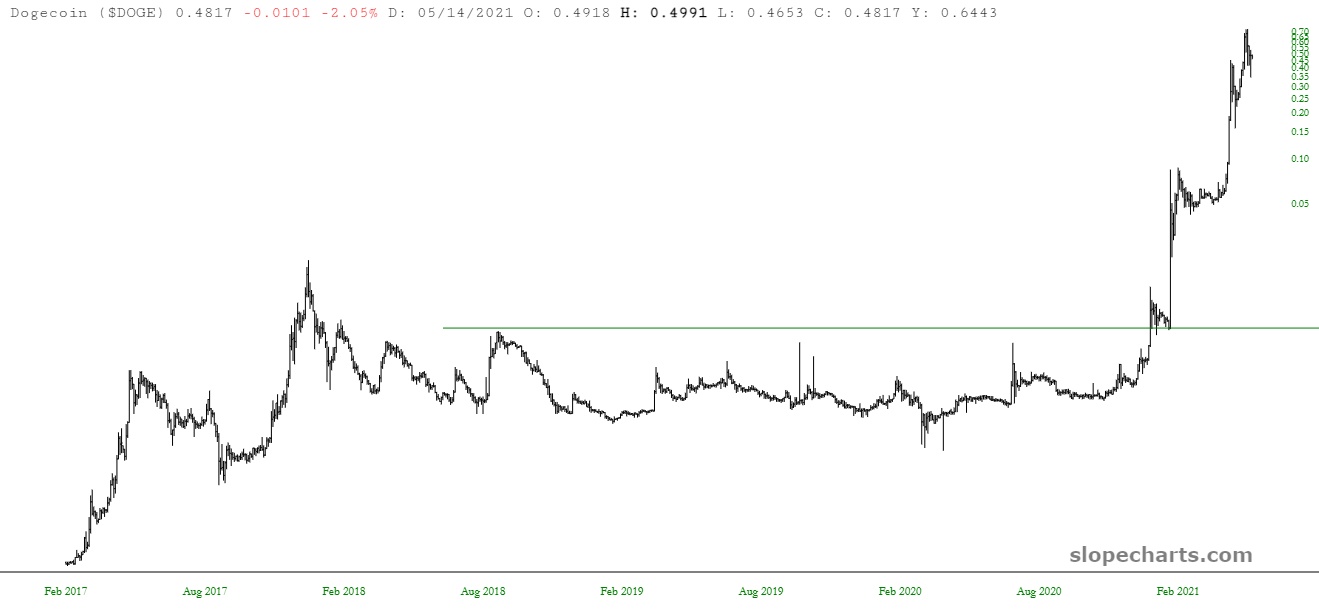
The daily charts go back for many years and can be augmented with whatever indicators and drawn objects you find helpful. Here are a few samples (click on any one for a larger version):

There is another important feature in the charts when it comes to cryptocurrencies:
In the crypto world, many of the trades are doing from one crypto to another, so the chart you’d want to look at is the cross-rate chart. In other words, if you are focused on buying Ethereum in Bitcoin terms (ETH/BTC), you could punch in a chart for $ETH/$BTC and get a ratio chart (assuming you are a premium member):
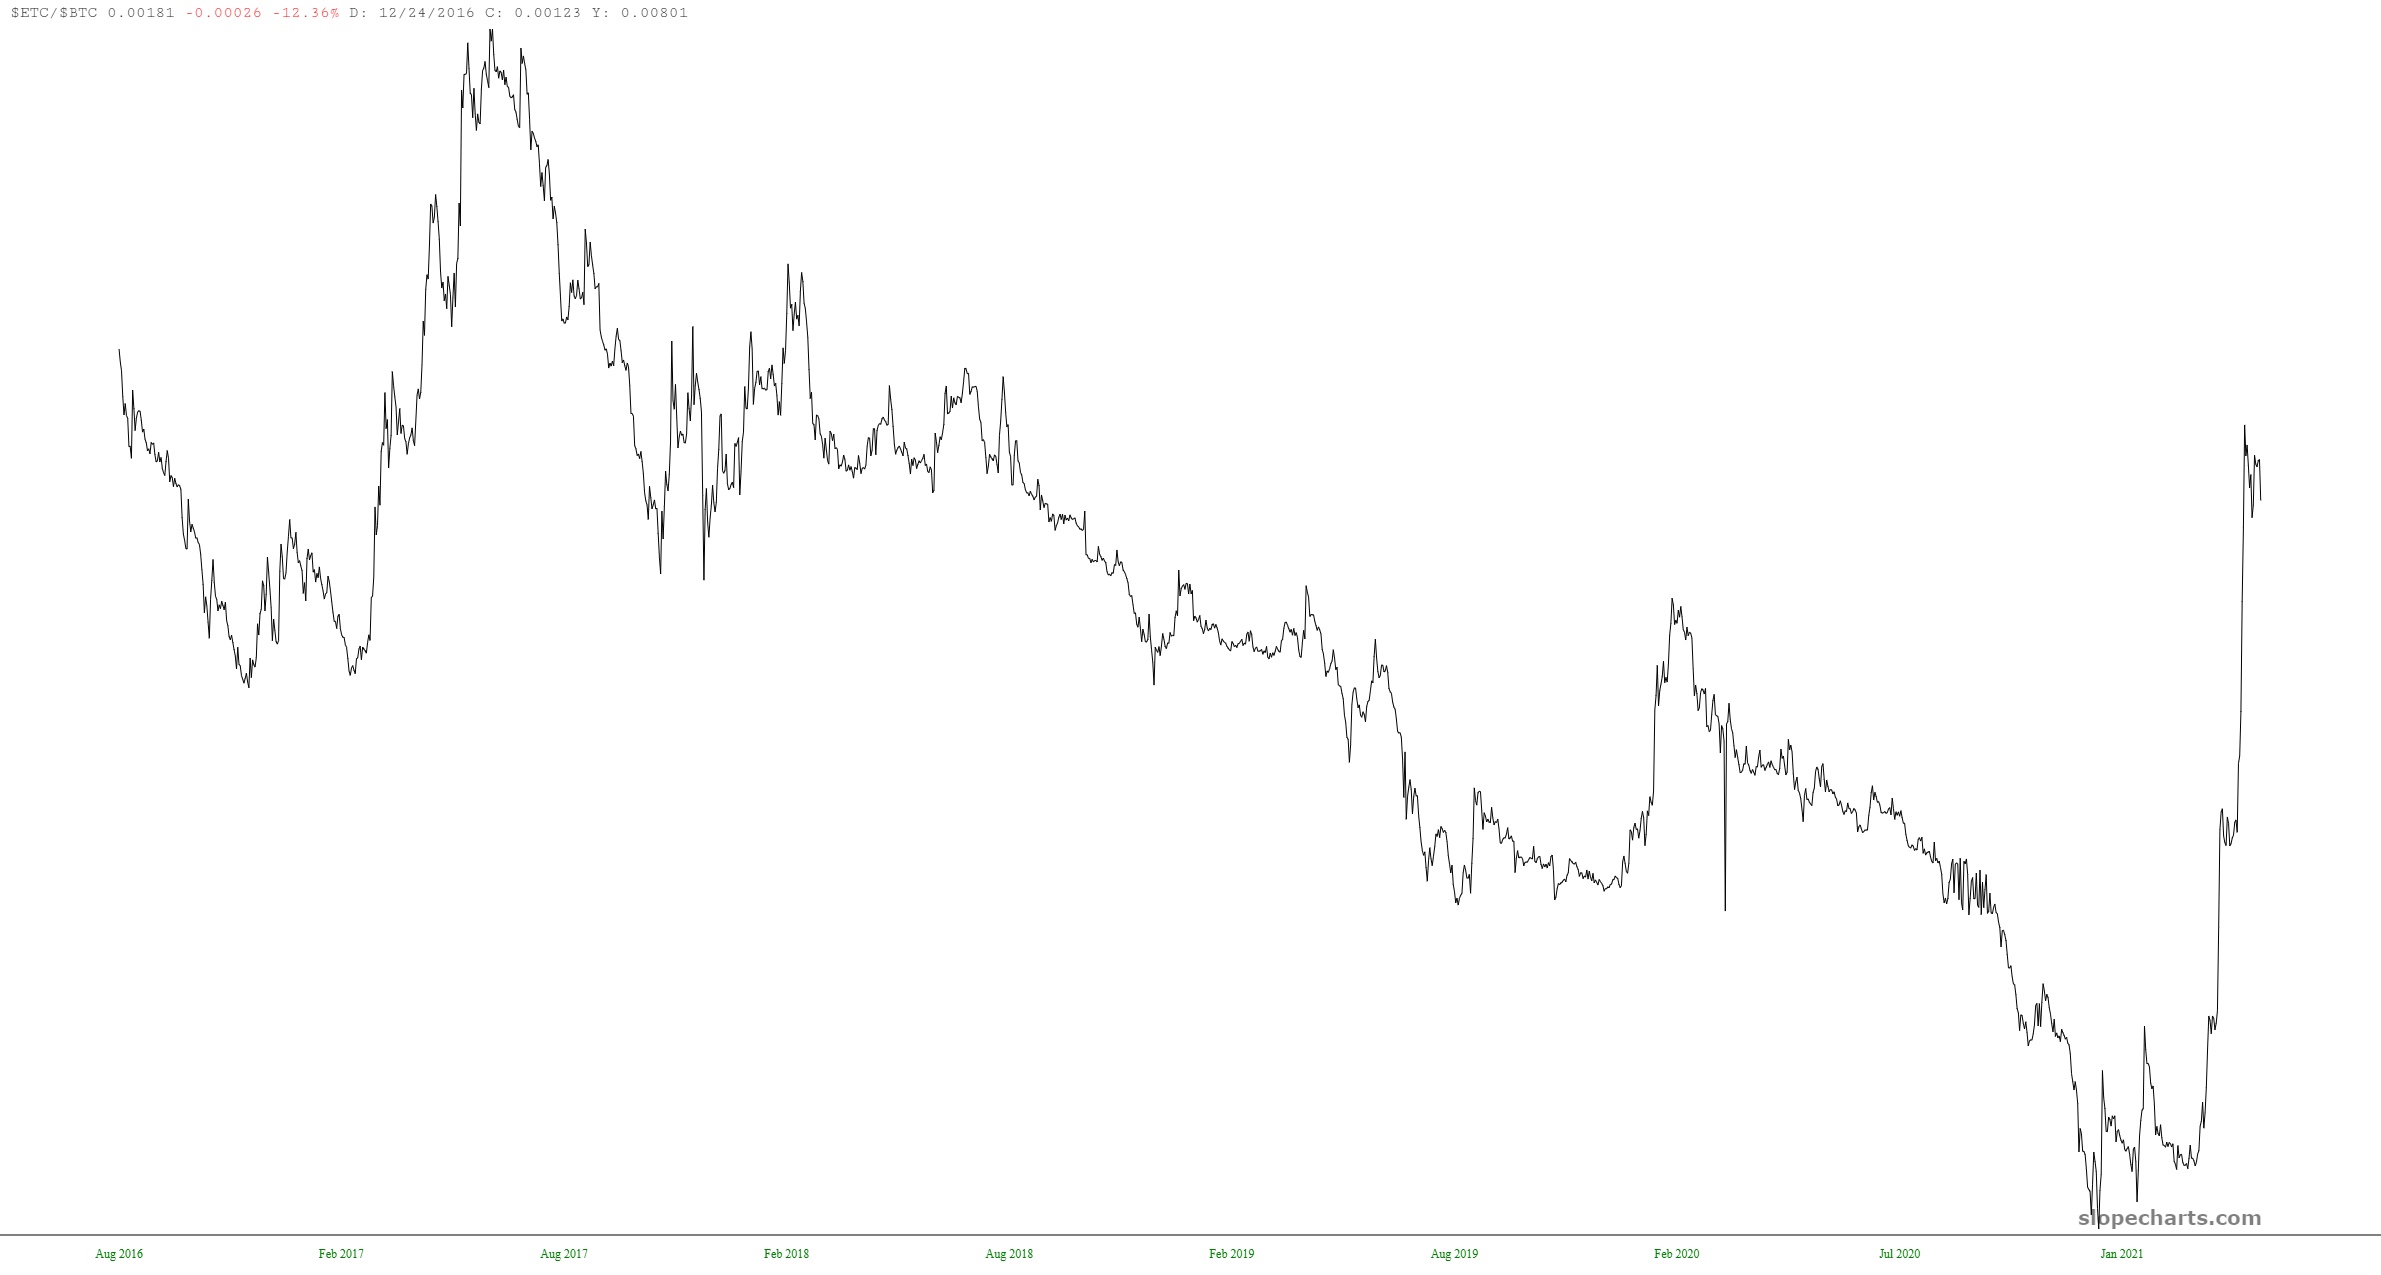
However, with this feature, you don’t have to be a premium member to get such a chart, and you can actually get a chart of superior quality.
The “trick” is to start the symbol off with the hashtag (#). So, with this example, the symbol to chart would be #ETH/BTC which would yield a chart like this:
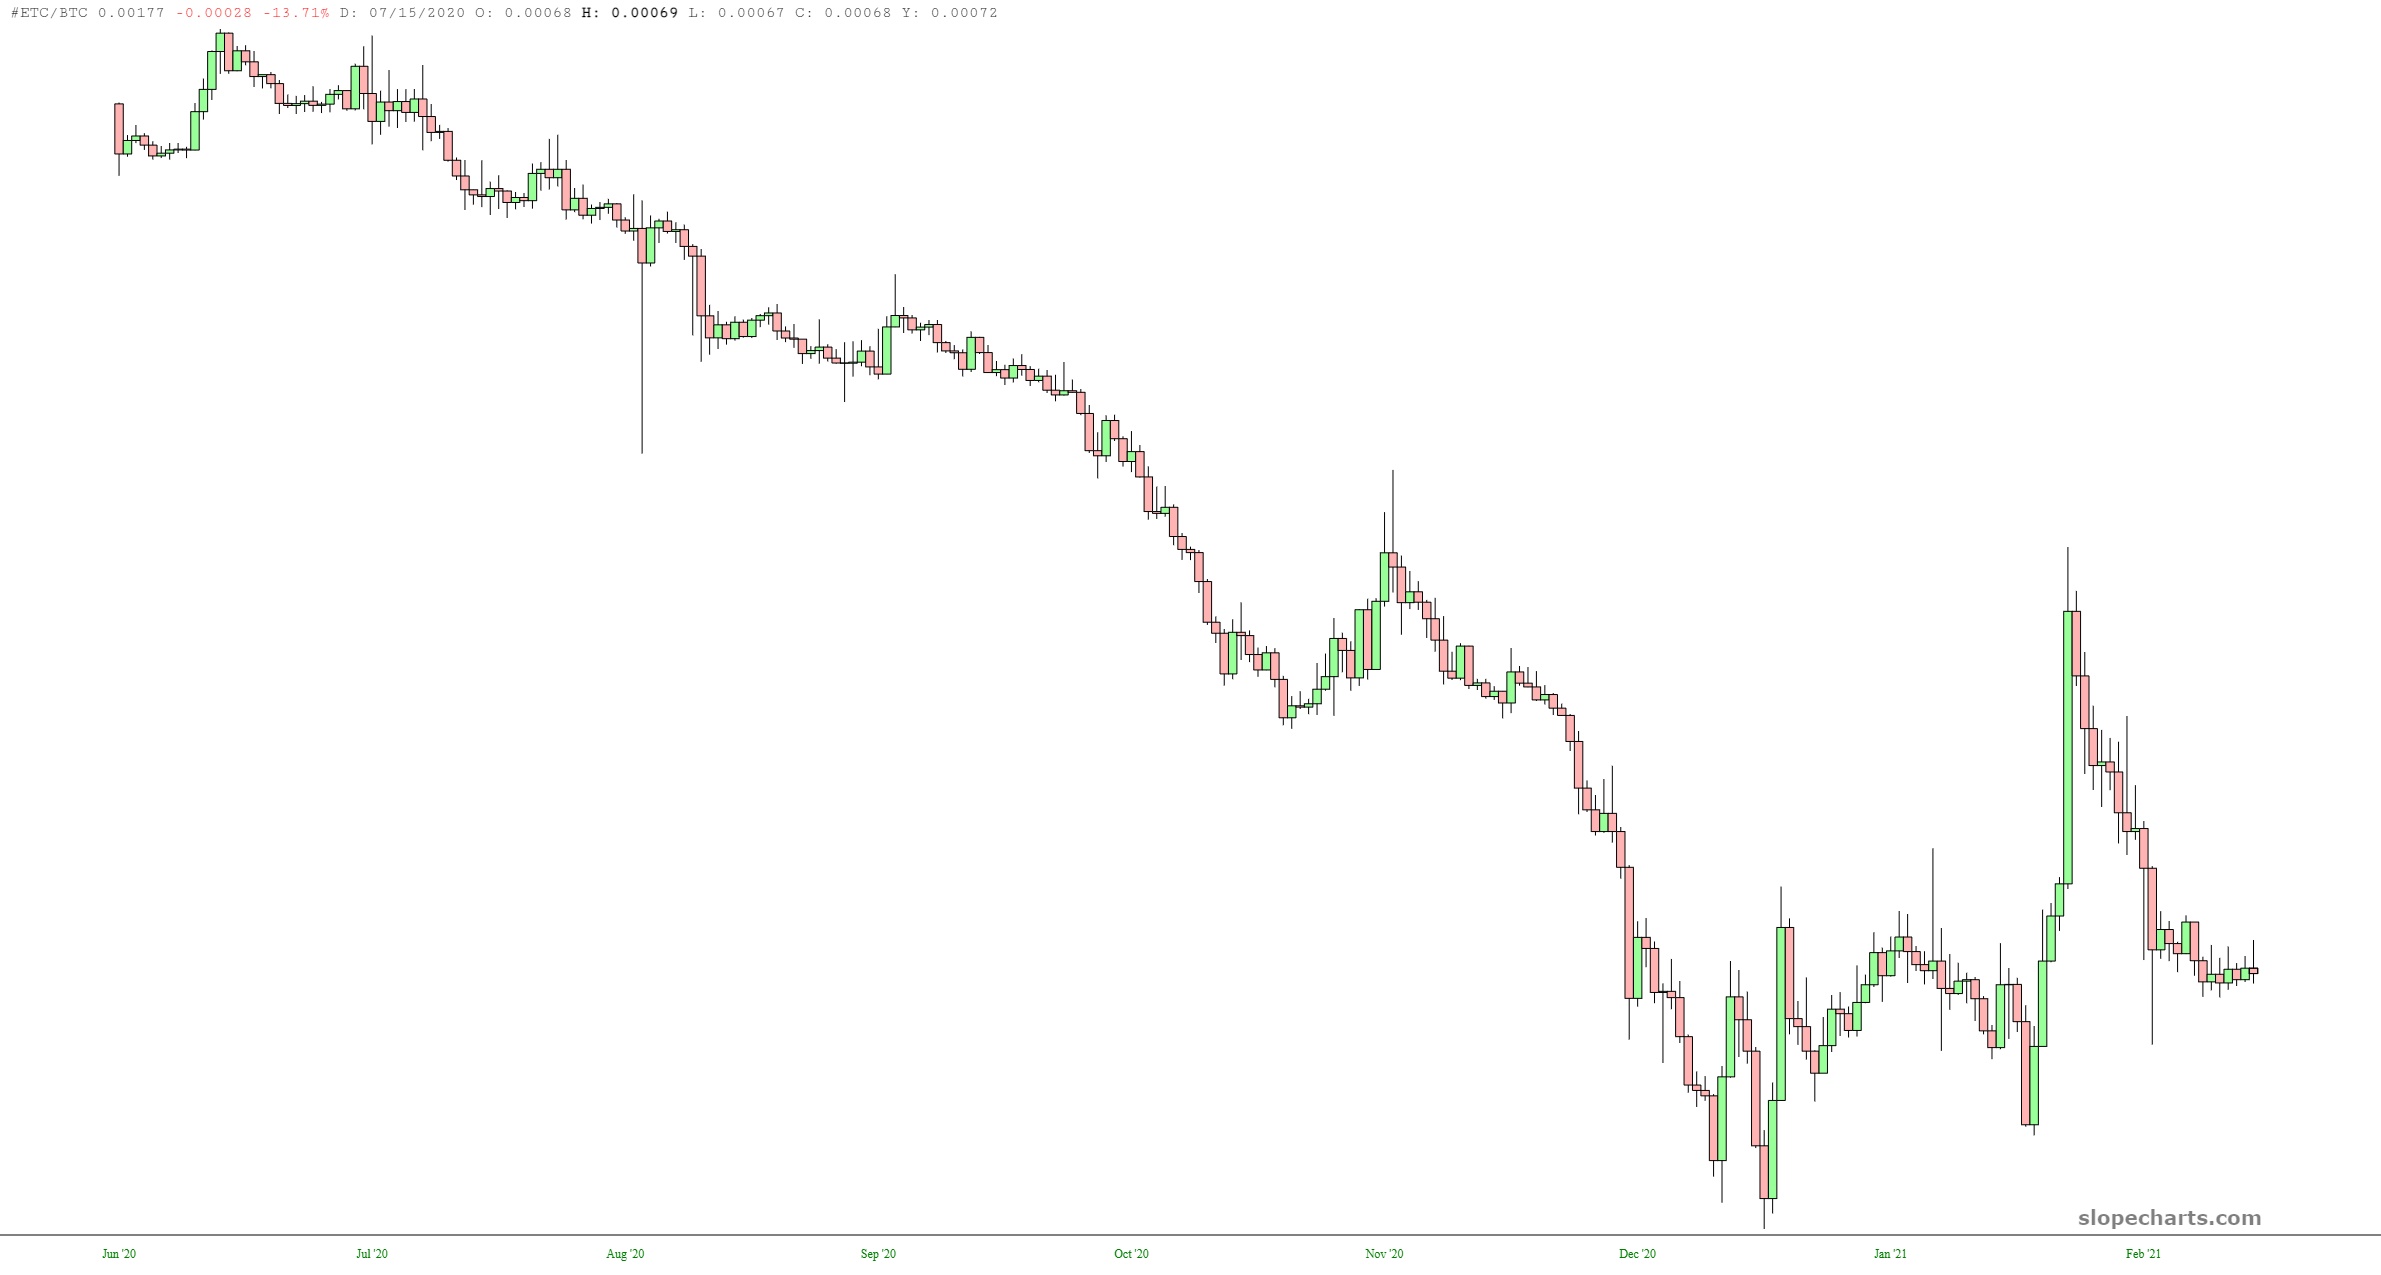
As you can see, this is not a line chart. Instead, it actually has the open, high, low, and close for each trading day for this concocted financial instrument. This is a more complete and useful graph for analysis.
