The Donchian Channel is easy to understand, because it is based on high prices and low prices. It consists of an upper band and a lower band. The upper band is “anchored” to the most recent high price, and the lower band is likewise anchored to the most recent low price.
The key words are “most recent”, because the number of days you use when creating the study defines how many days backward the study observes for low and high prices. For example, if you use the default value of 20 days, it means that the upper band will be based on the highest price bar for the last 20 days and the lower band will be based on the lowest price bar for the last 20 days.
When you choose this study, it lets you define several parameters:
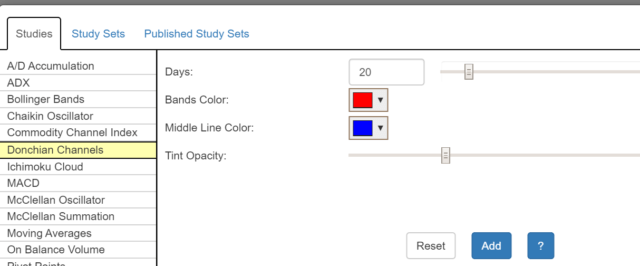
The first is the number of Days, which you can enter manually or adjust via the slider bar next to the entry box. If you have already placed the channel on your chart, dragging the slider bar dynamically shows you the effect of changing days directly on your screen.
You can control the Bands Color (which is the line color as well as the “filled in” area between the lines) along with the Middle Line Color. The “middle line” is precisely that: the midpoint between the upper and lower bands. You can also control the Tint Opacity, which also dynamically changes with its own slider so you can instantly see what works best for you.
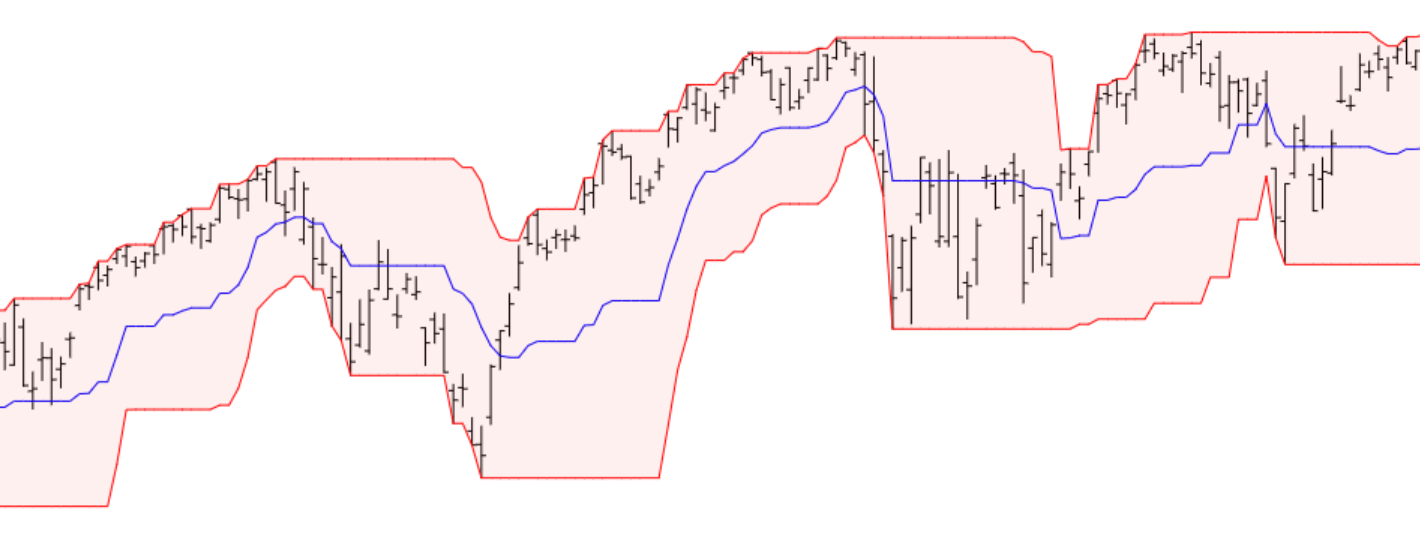
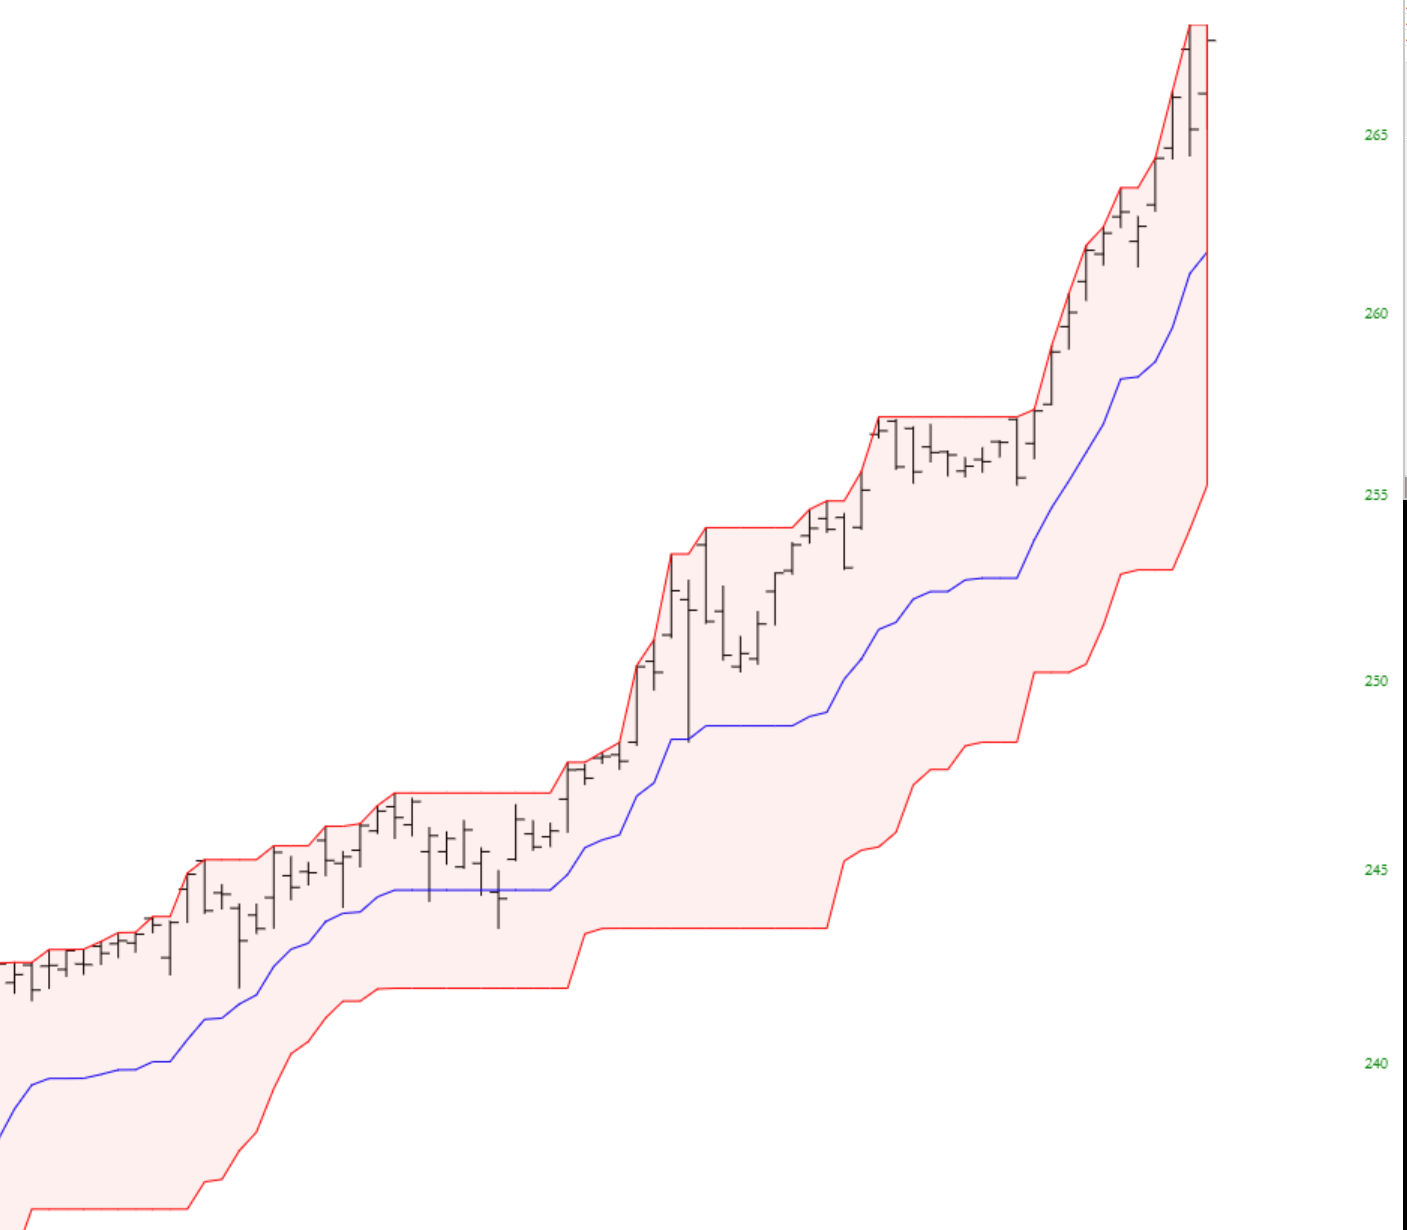
Here are a few examples of a Donchian Channel with SPY price data:

Some of the ways traders use this channel include:
- Going long at the first touch of the lower band and going short at the first touch of the upper band;
- Using the crossover of the midline as a signal to close a position;
- Going long when the channel switches from declining to ascending, and going short when the channel switches from ascending to declining.
