The Earnings Events feature, exclusively available to Gold and Platinum members, marries
The date-based earnings information is consolidated into a new Data Panel called Earnings Events which, as with all the Data Panels, can be accessed by clicking the left or right arrows at the top of the panel and navigating to the desired one.
Below the Earnings Events title is the present day. If you are looking at it on a weekend (or during an exceptionally quiet reporting period), it will be blank. However, you can use the left and right arrows to navigate through time and see what symbols are reporting are a given day. On some dates, there can be literally hundreds of companies reporting.
The beauty of this, of course, is that it gives you a powerful tool to hone in on precisely where the major market action is going to be on any given day. By scrolling through a list of all the symbols that will be issuing earnings, you may well find some exciting trading opportunities and be able to prepare your setups accordingly.
There is little doubt you will get ideas that you would otherwise not have had if you didn’t have a ready-made list to examine for a specific trading day. Note that the symbols are presented in order of volume, not alphabetically. This is so you can be aware of what the most heavily-traded symbols are and focus mainly on those at the top.
However, a list of hundreds of symbols (on especially busy days) can be daunting, and there is a way to trim the list down to something more manageable. By clicking on the “Earnings Events” title at the top, you can access a menu item called Filter Symbols. Just like the same menu item under the Watch Lists panel, it looks like this:
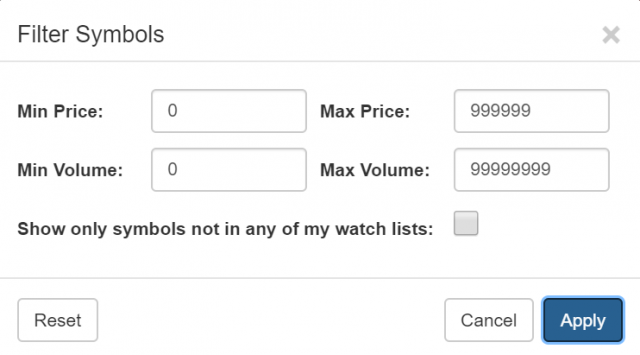
Using this dialog box, you can dictate the minimum (or maximum) price and volume parameters for the list and thereby dispatch with symbols that are outside your own customized price and volume range.
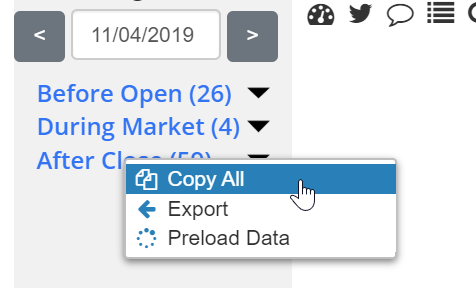
You can right-click on any time category (Before Open, During Market, or After Close) and access a sub-menu which lets you do any of these three things:
- copy all the symbols of that list to a watchlist of your choosing;
- export all the symbols of that list to a text file;
- preload the data for substantially faster scrolling through charts
As with the regular Watch Lists, you can use the arrow keys to scroll up and down the list, and you can right-click on any given symbol to access these commands:
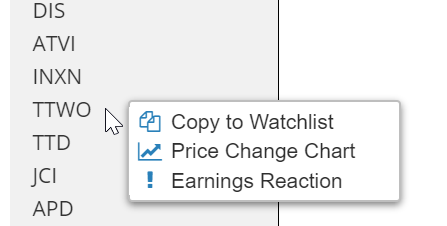
These items are fairly self-explanatory, but it should be emphasized the second and third ones were deliberately included since they are germane to options trading.
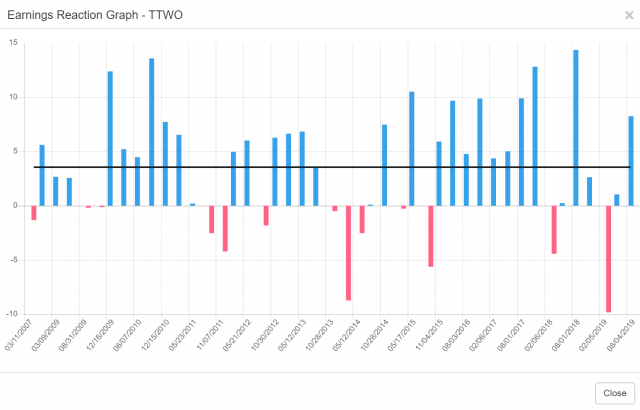
By clicking on the Price Change Chart (available only to Platinum members), you will get in a new tab on your browser with the style of charts described on this page. And, by clicking on Earnings Reaction (available to both Gold and Platinum members), you will get a new window on top of your normal charts that shows, as below, the historical price reaction that have taken place during past reporting periods:
Although both equity traders and options traders will get tremendous benefit from Earnings Events, options traders in particular will find it useful since some options strategies are geared for exploiting the price dynamism that takes place when earnings news hits the wires. You will be that much better-prepared than other traders by having this at your disposal.
