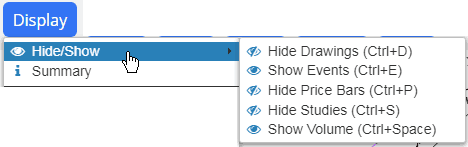
SlopeCharts can display for you three distinct time-based events on top of the price chart itself. Pressing Ctrl-E on the keyboard will toggle the display of these events on and off, and by pointing to any of the letters signifying the event you can get more details on that specific instance. You can also control this via the Display menu at the top of SlopeCharts.
The four events displayed are as follows:
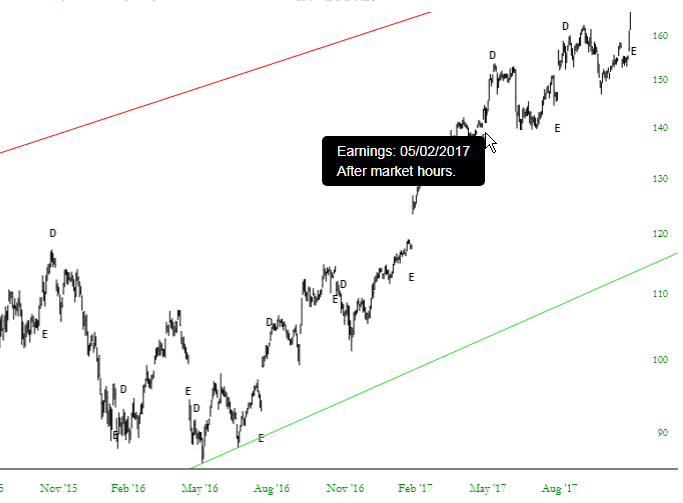
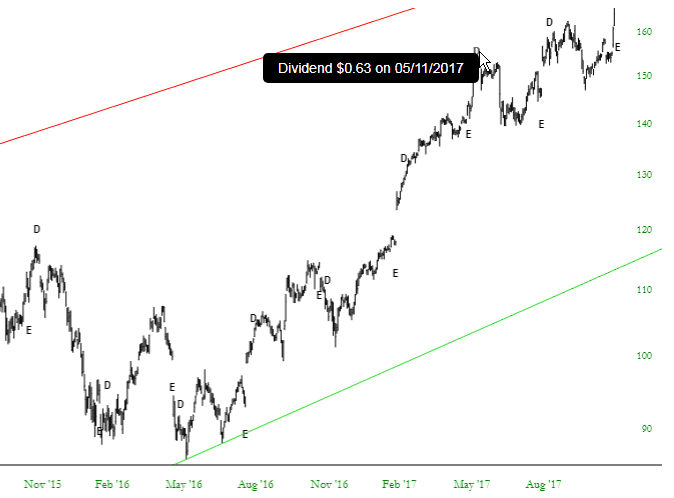
Earnings, designated by the letter “E”, which typically are announcements that happen once per quarter for any public company. Moving over the “E” shows you the date of the earnings announcement and whether or not the news was came before or after normal trading hours.
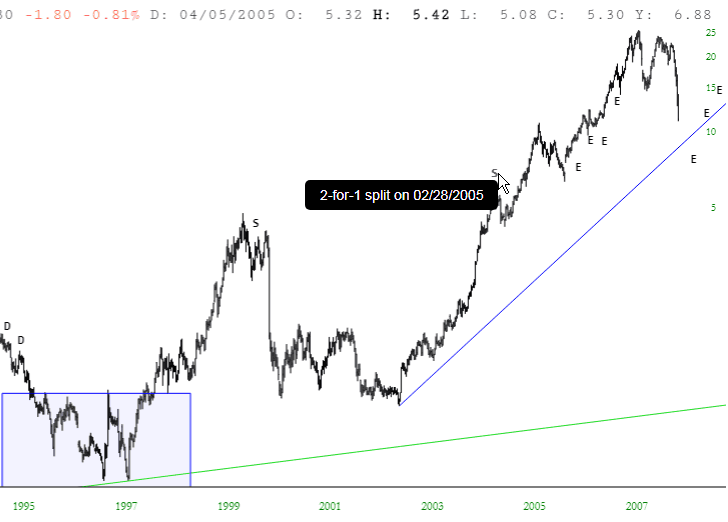
Splits, designed by the letter “S” and accompanied by the split date as well as ratio. Common splits such as “2 for 1” are shown with words, whereas more peculiar splits are displayed as factors (for instance, 0.10 would be a 10-for-1 split).
Dividends, designed by the letter “D” are shown with their payment dates and amounts.
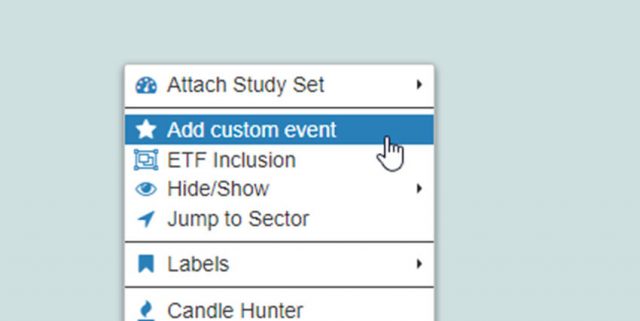
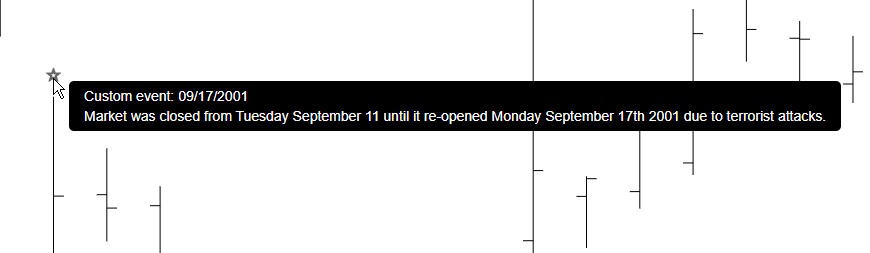
Custom Events: This is a very special kind of “event” because it is something you create for yourself.
This feature allows you to add a marker to any part of a chart with a note in it. The note might pertain to the stock (“Elon Musk announces intention to buy Twitter“) or earnings (“Big earnings disappointment“) or news (“Hurricanes shut down refineries and push up energy prices“) or anything you like (“Bought my first 50 shares on this day.”) You can make any note about anything you chart on any particular date, and it will be remembered for your later reference.
To add a custom event, just right-click on the chart on whatever date is appropriate for your note, and choose this from the pop-up menu:
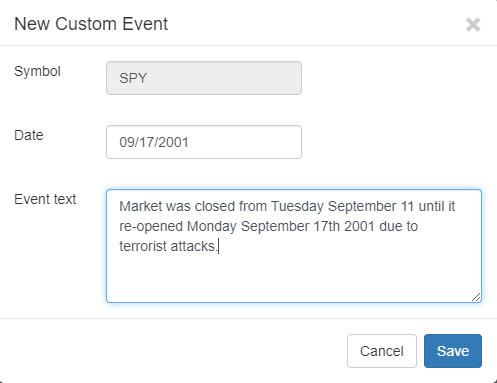
A dialog box will appear with the Symbol and Date automatically added. All you need to do is type whatever note you want and click Save.
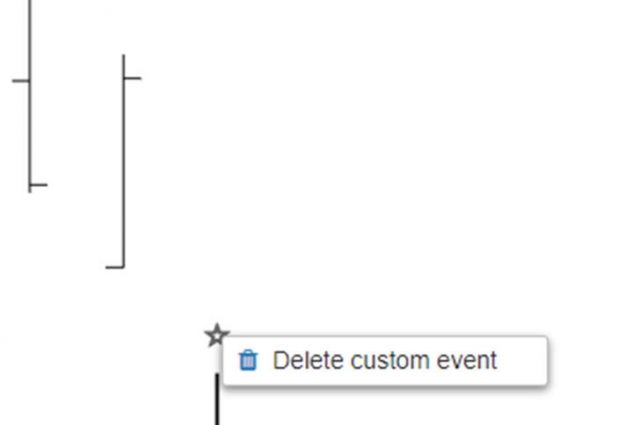
Once it is saved, a star icon will show up as a new kind of event. Recall that the other kinds of “events” (stock splits, dividends, and earnings announcements) are shown on your chart if you chose to display them. The star is simply another kind of event which shows up alongside all the others. It is the only one of the four event types which you control.
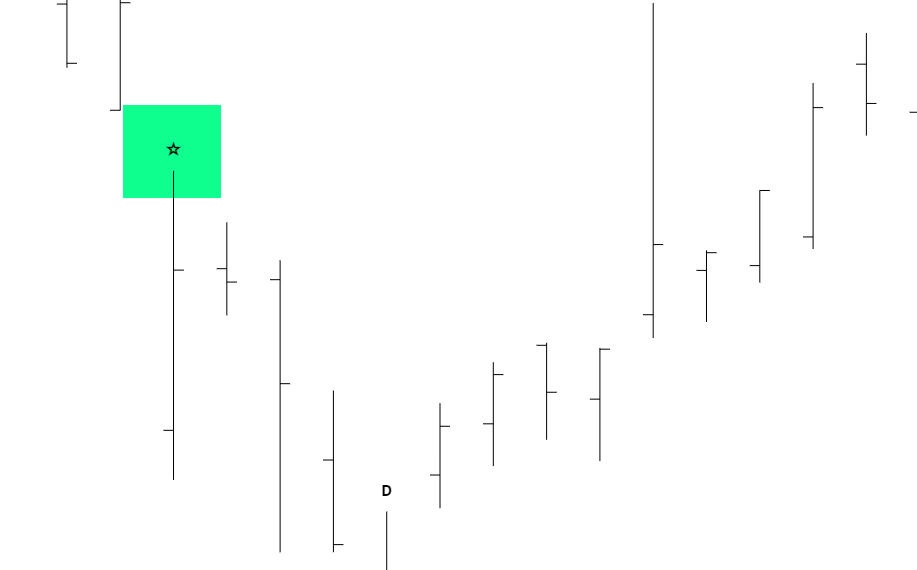
Thus, when you point to any star, whatever comment associated with that custom event will be displayed.
If you decide to delete a custom event, just right-click on the right and click on this menu item: