Once of the more unusual looking studies, and one intended to offer clear levels of support or resistance, is called the Ichimoku Cloud. Here are the parameters for this feature in the Technical Studies dialog box:
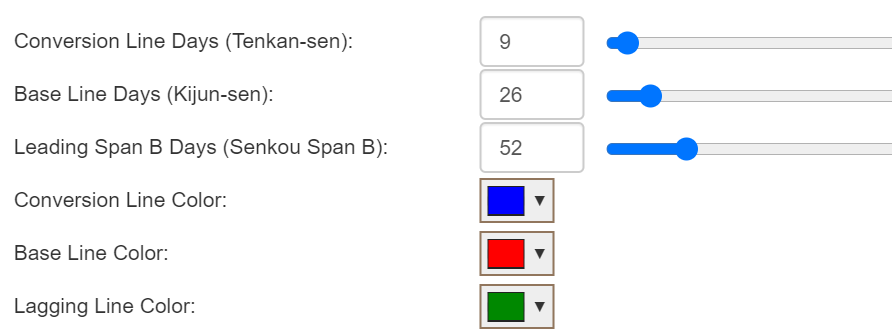
The Ichimoku Cloud is a gathering of technical indicators that suggest support and resistance levels, as well as direction and momentum. It uses multiple moving averages to do so (with the default number of days used, as shown above, being 9, 26, and 52).
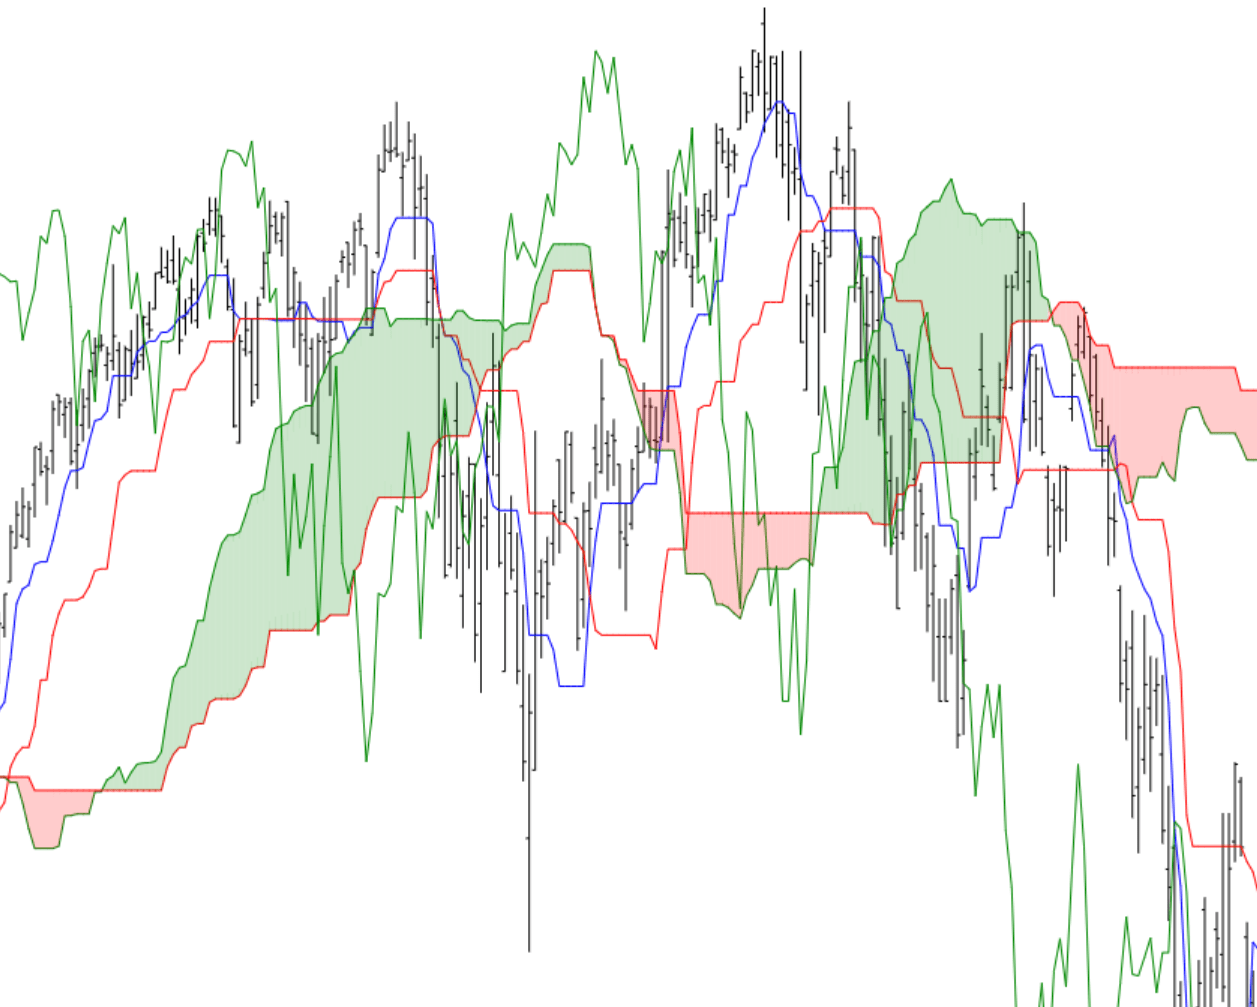
This technique was developed by Goichi Hosoda, a Japanese journalist, and it was originally described in the late 1960s. The first thing to notice is whether, for lack of a better term, the study looks messy or not. If it is messy, such as the one portion shown here, it would not be helpful or useful at the present time.
The two examples below offer a cleaner, easier-to-interpret “cloud”, with the first one being an uptrending bullish instrument and the second being a downtrending bearish instrument.
Broadly speaking:
- If the cloud is moving up, it is bullish; if the cloud is moving down, it is bearish;
- The price of the security should be above the cloud for bullish trades and below the cloud for bearish ones;
- A “crossover” of the faster-moving Conversion line above (for bullish) or below (for bearish) the base line can be used as a trading signal.
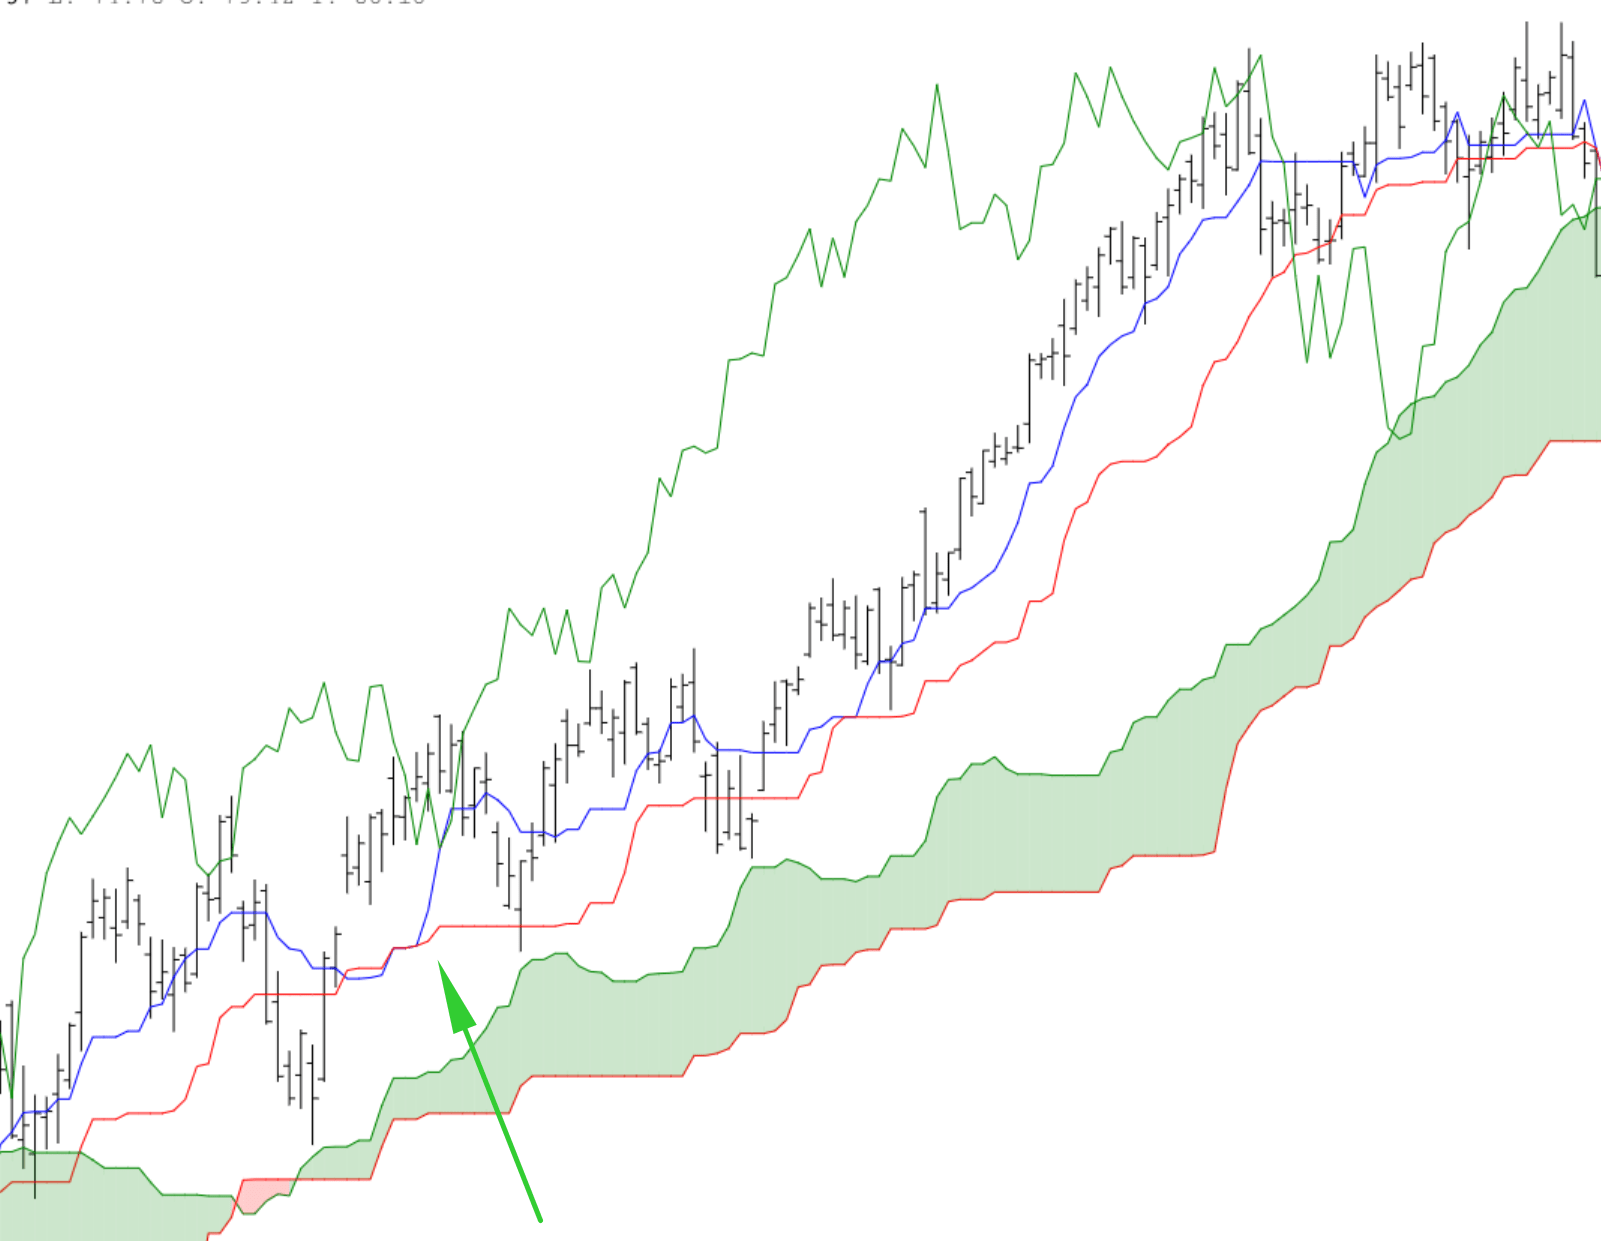
Here, for instance, is a bullish setup. The prices of the security are persistently above the cloud, and the arrow marks the crossover point.
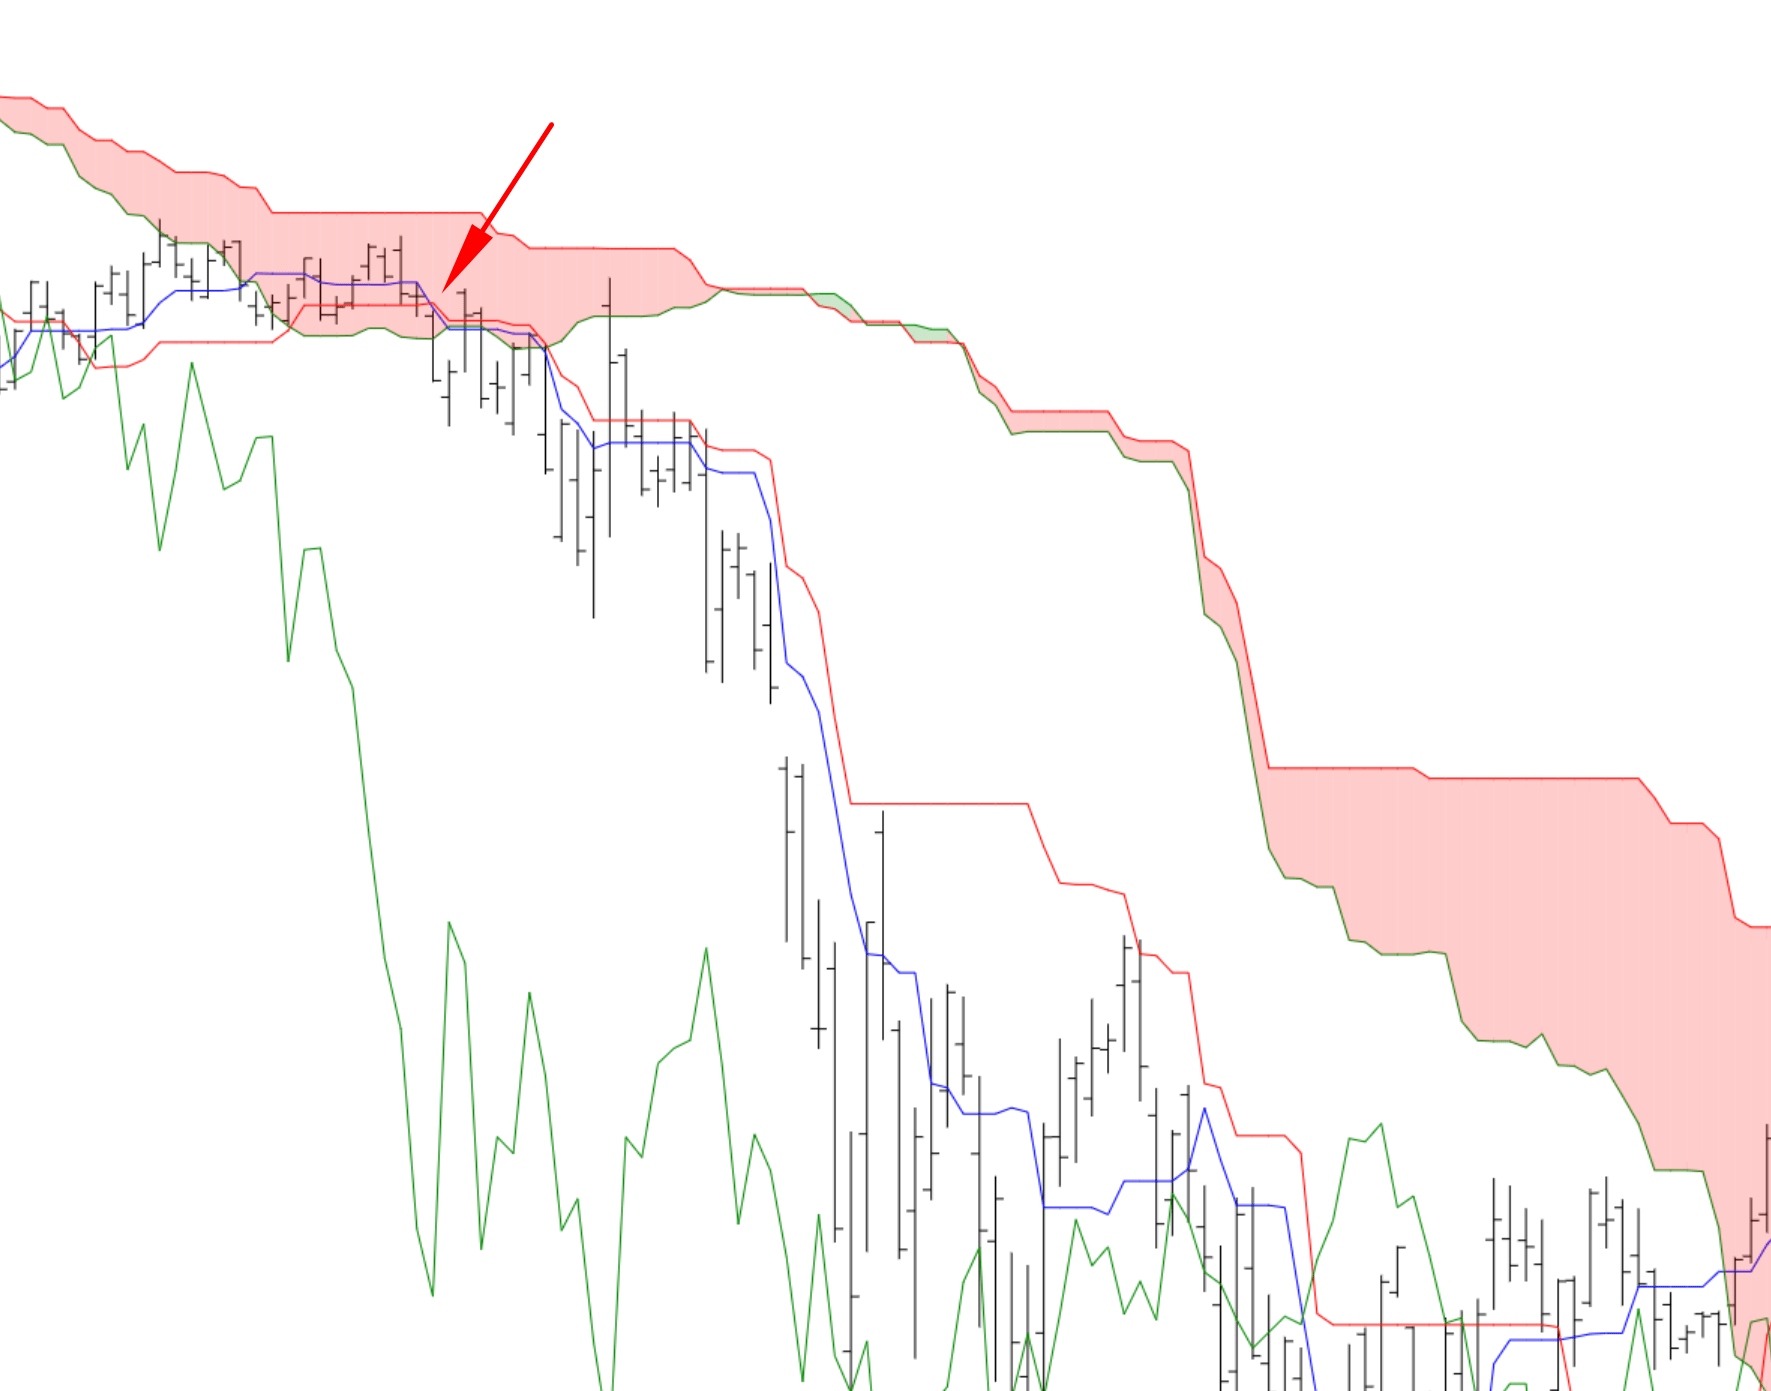
In contrast, here is a bearish setup, with the red arrow denoting the crossunder point.