The Keltner Channel is very similar to the Bollinger Band study in the respect that prices are “bounded” by an upper and lower channel line. The difference with Keltner is that the middle line is a moving average whereas the upper and lower channel lines are based on an Average True Range (ATR) above and below that moving average.
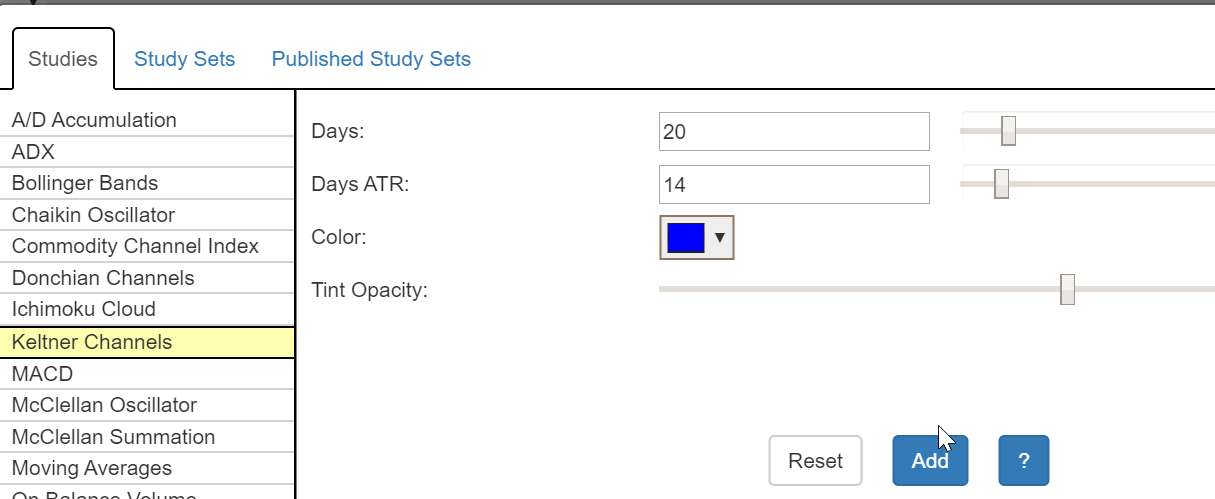
The default settings, as shown in the technical studies dialog box, are 20 days for the moving average and 14 days for the ATR calculation. You can hand-enter different figures (or use the sliders), and you can change the color of the “banded” area as well as the color’s opacity. As with other SlopeCharts indicator controls, you can see these dynamically update as you adjust the settings.
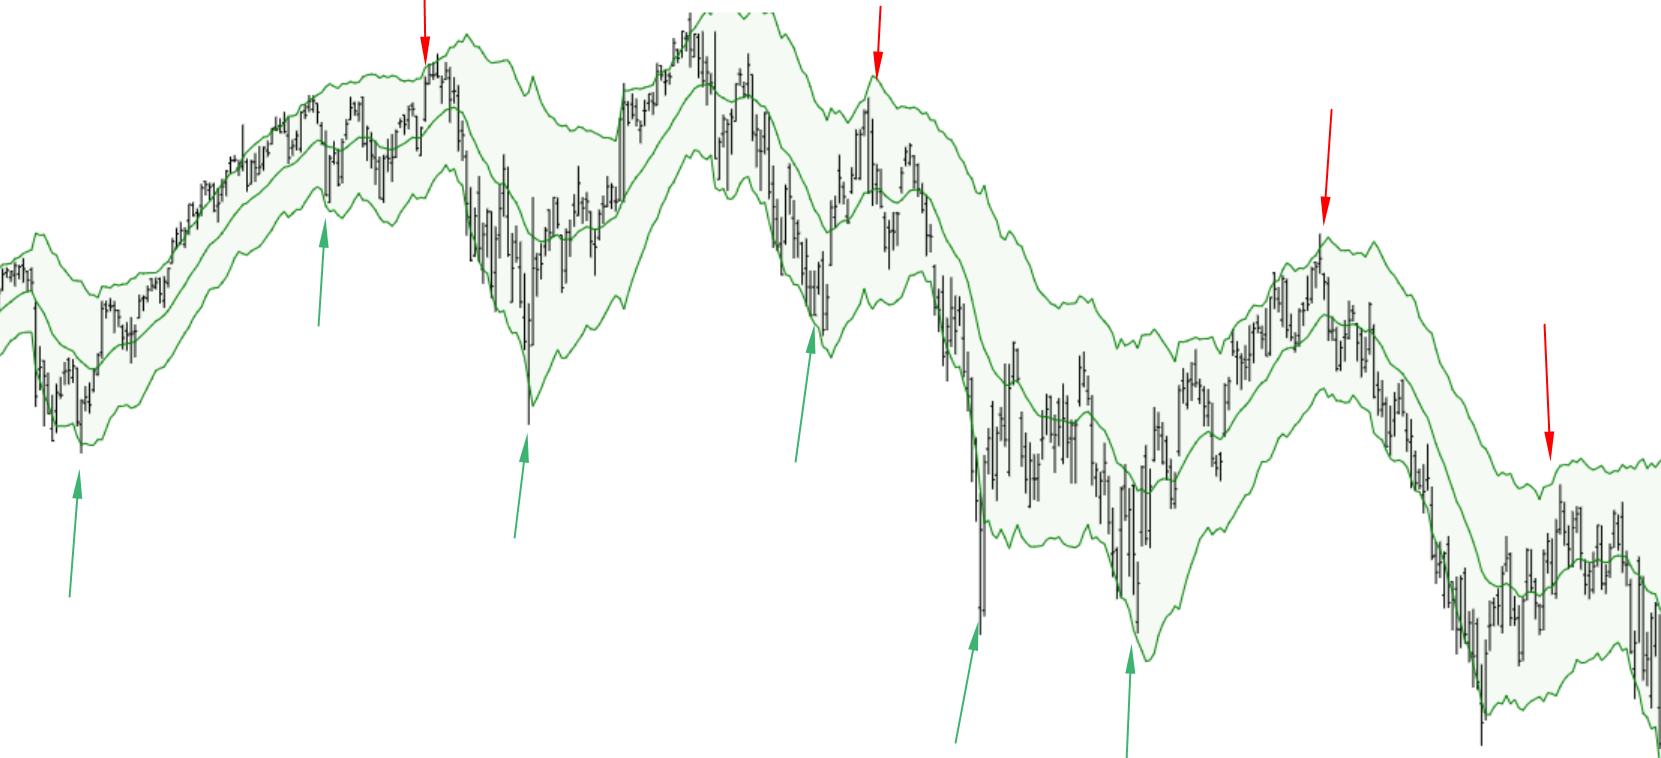
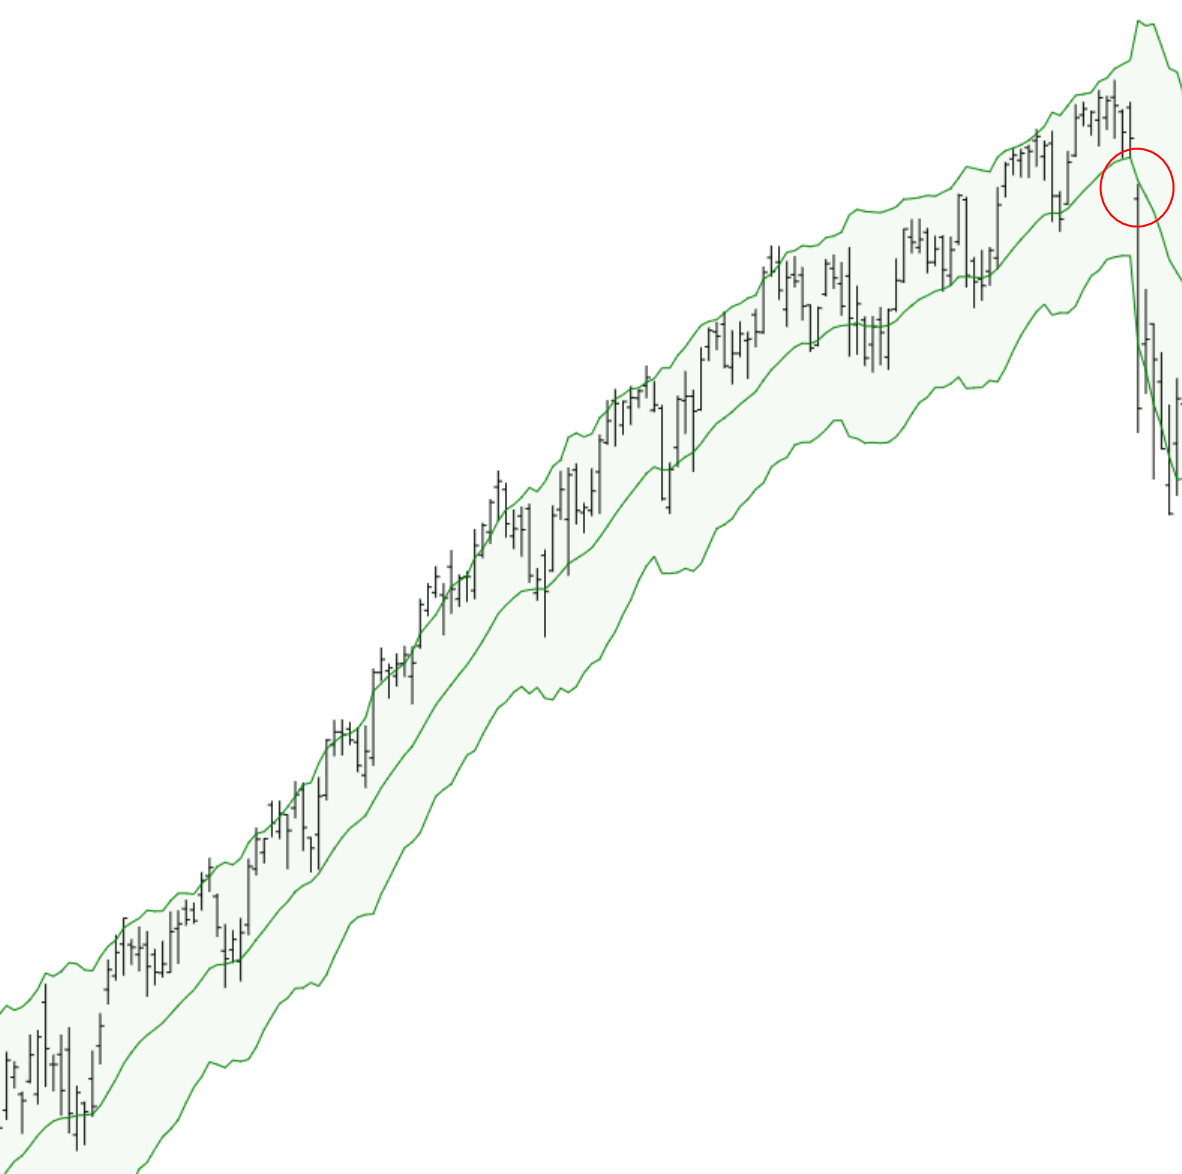
How you use Keltner depends on the general nature of the market. You could, for example, use it in a trending market to monitor for a major trend reversal……..
……or, likewise, in a downtrend……

…….or, in a more volatile market, you could spot buying and selling opportunities as it hits extremes of the boundary lines.