The Relative Strength Index (RSI) is a technical indicator used in the analysis of financial markets to determine when a security is overbought or oversold. It is intended to chart the current and historical strength or weakness based on the prices of a recent trading period.
Understanding the Relative Strength Index
The Relative Strength Index is a technical momentum indicator that compares the magnitude of recent gains to recent losses using speed and change of price to help determine overbought and oversold conditions. The stock analysis indicator was developed by J. Welles Wilder, Jr. in the book New Concepts in Technical Trading Systems (1978).
RSI is represented by an oscillating line graph between the extremes of 0 and 100. The relative strength index is calculated with a two-part formula using a 14-day lookback period. Once it is calculated, an oscillating line can be plotted in a chart beneath the asset’s price.
How To Use RSI
RSI is intended to indicate when a stock is overbought or oversold. The RSI will rise with more frequent and larger positive closes of the stock price, and the RSI will fall as the frequency and size of losing closes increase.
If a security is being overbought, it is considered overvalued and the price of the security could face a corrective pullback or trend reversal. On the other hand, if a security is oversold, the price can be considered to be undervalued and a possible buying opportunity for investors.
Traditionally, and according to Wilder, the RSI is considered overbought when above 70 and oversold when below 30. These levels are denoted with two horizontal lines on the relative strength index portion of the chart.
It is common to use RSI readings when there is an identifiable current trend. During an uptrend, RSI tends to stay above 30 and can frequently exceed 70. On the other hand, when in a downtrend, it is rare to see the RSI hit 70, and the indicator frequently goes under 30. Therefore, some traders look to use RSI with trend indicators to check trend strength and spot potential reversals. Other signals can be generated by looking for divergences, failure swings and centerline crossovers.
SlopeCharts RSI Tool Guide
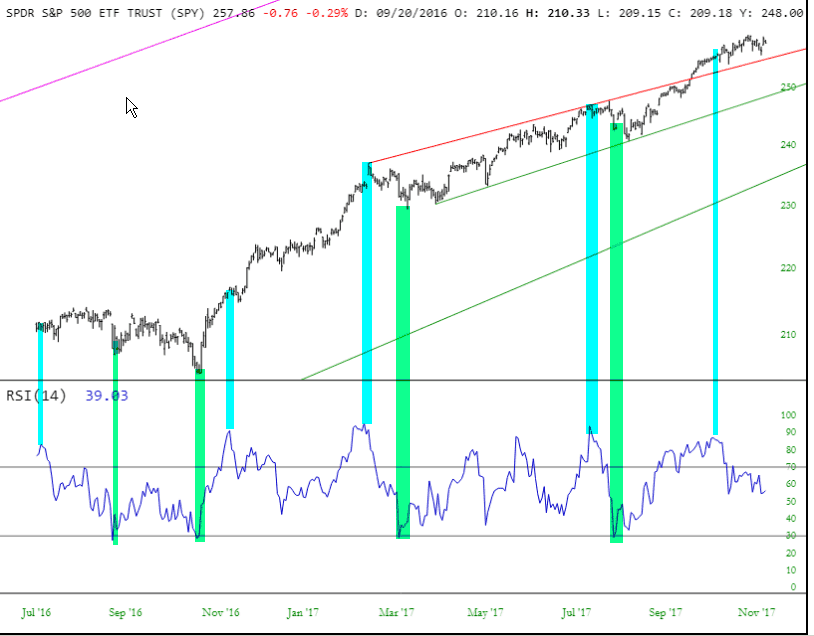
The Relative Strength Indicator is a momentum oscillator that is most useful for stocks trading within a range. The RSI line chart appears as a separate pane, and it can range from 0 at the bottom to 100 at the top. There are two horizontal lines which appear in this chart at the 30 and 70 values, since crossing below 30 is considered “oversold” and crossing above 70 is considered “overbought”. Here is an example chart showing various overbought and oversold points.
By no means does the indicator reaching 30 or 70 mean the stock is going to suddenly reverse in the opposite direction. A financial instrument can have an ‘overbought” status for weeks, months, or even years and still keep grinding higher. However, awareness of the RSI’s relative position can be helpful in understanding, on the whole, the relative position of a financial instrument’s price to its historical behavior.
The dialog box for RSI allows you to adjust the days used to calculate the moving average as well as the color for the line chart.

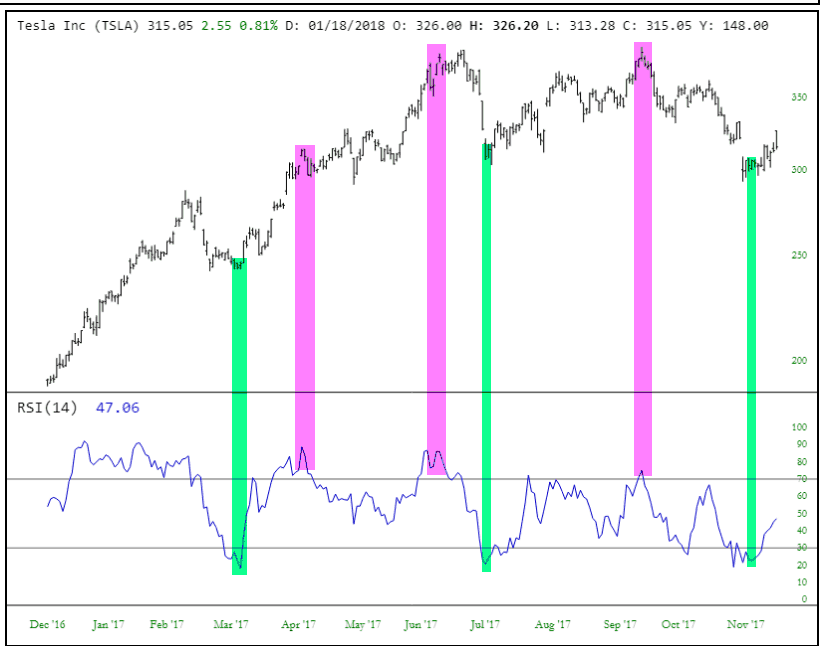
Below is a good example of an instance when the relative strength index was very useful. The stock, Tesla Motors (TSLA), was moving in broad cycles that lasted several weeks at a time. The “oversold” zones are tinted in magenta and the “overbought” zones in green (these tints do not appear in SlopeCharts; they are simply added here for clarity).