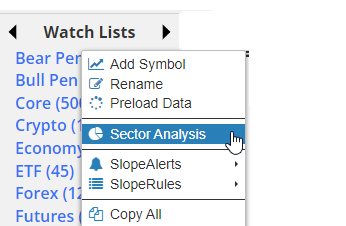
This feature is specifically within SlopeCharts: the ability to instantly analyze the sector composition of any given watch list. To use this feature, point to any watch list title in SlopeCharts, right click the mouse, and choose Sector Analysis from the pop-up menu.
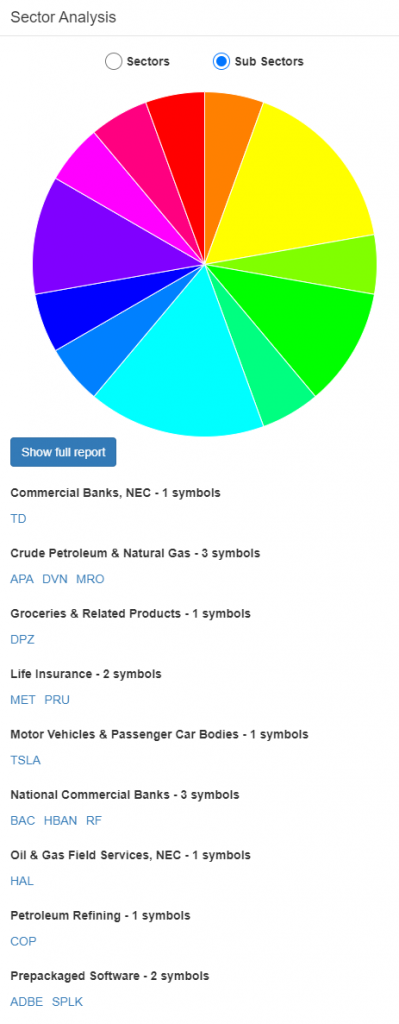
You will instantly be presented with a pie chart showing where the sector composition of all the symbols within that list. Point to any slice of the pie to see what the name of that sector is and how many of the list’s symbols belong to it.
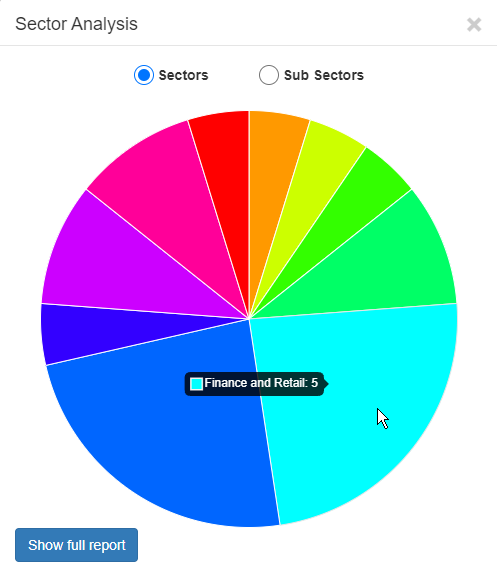
Even if your list has hundreds of symbols in it, you’ll be amazed how fast this analysis is performed.
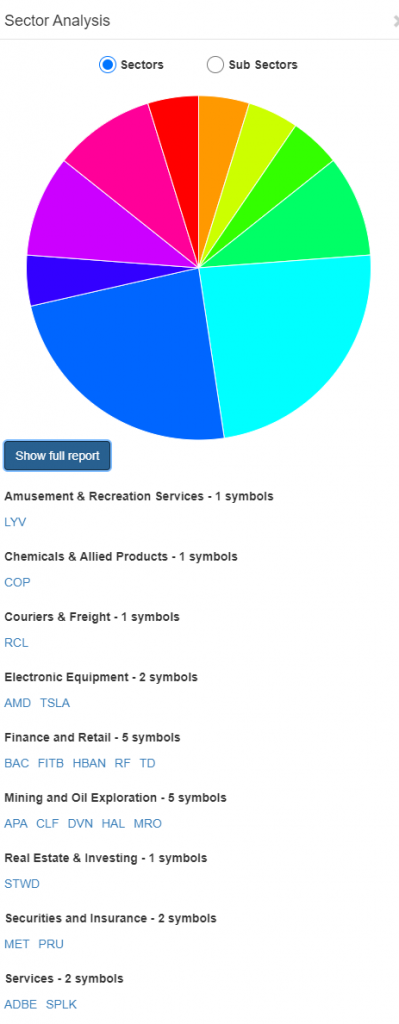
You can click on the “Show full report” button to see in detail what all the sectors are and which symbols are within them. Both the sector names and tickers will be shown in alphabetical order.
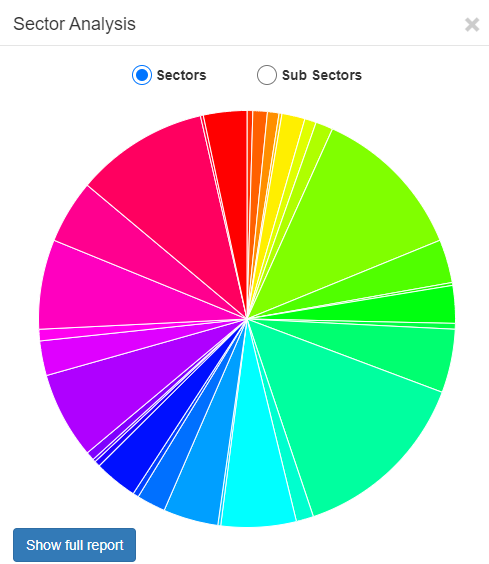
At any time, you can toggle between the Sectors and Sub-Sectors radio buttons to see different granularities of analysis. You can even click on any individual ticker symbol to see that particular chart loaded in the background, all without leaving the sector analysis window.
This feature is exclusively to Gold and Platinum members. You can explore various membership features by clicking here.
