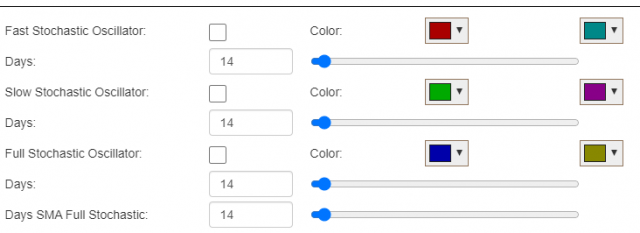
The Stochastic Oscillator study is an overbought/oversold feature which really contains three different kinds of stochastics: Fast, Slow, and Full. Controlling which of these is displayed, how many days are used in the calculation, and which colors to use for the lines is all controlled in this single dialog box which comes up when you choose the Stochastic Oscillator study:
For the purpose of this illustration, we’ll use the Fast Stochastic by checking the first checkbox and leaving the default values. The study lines meander between 0 and 100, with the level 20 and below typically considered “oversold” and the level 80 and above being considered ‘overbought”. Keep in mind that oversold does not necessarily mean a rally is about to take place, nor does overbought mean the stock is going to fall. Financial instruments can remain overbought or oversold for weeks at a time, if the momentum continues to be strong in a certain direction.
There are three general ways that traders use the stochastic study:: they look for emergences from the extreme levels of 20 and 80, they look for divergences between the equity price direction and the study’s direction, and they look for crossovers in the two lines which make up the study.
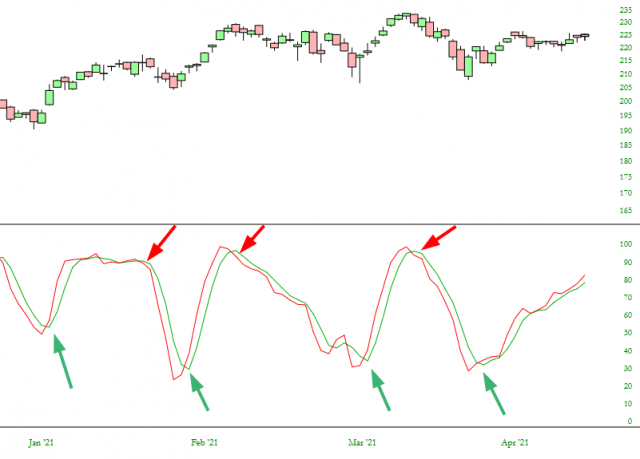
For example, here is a chart of the small caps ETF (symbol IWM) over a period of months. Below is the stochastic oscillator, with green arrows marking points where the red “signal line” crossed above the green line (Buy opportunities, marked with a green arrow) or the red line crossed below the green line (Sell opportunities, marked with a red arrow). These signals were very accurate indications as to the change of direction in this fund, although it is not often that a given security moves with such regularity.
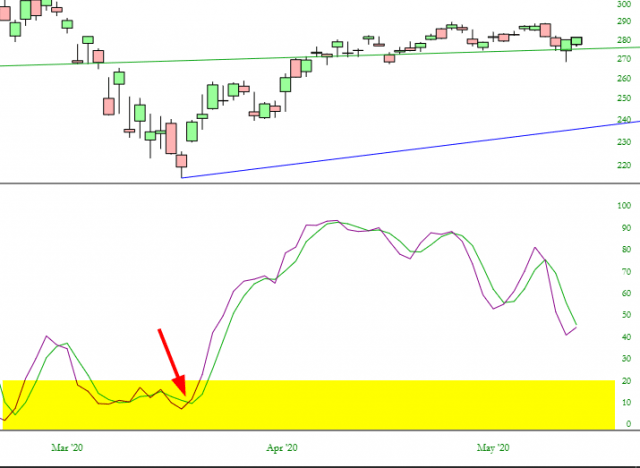
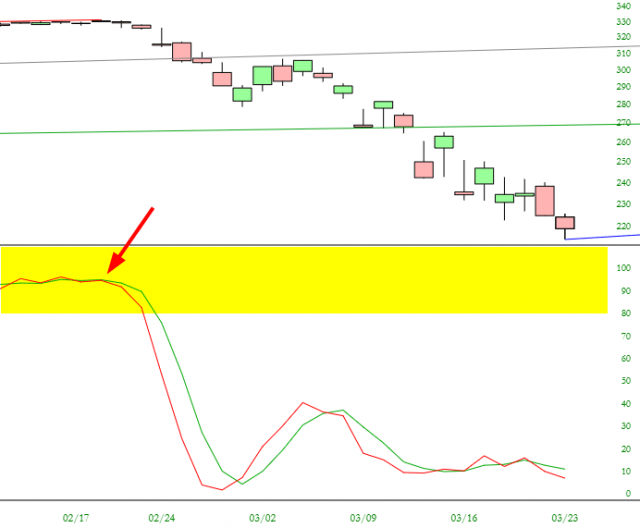
For a more stringent signal, a trader might require that for a given “Sell” signal, two conditions be met: first, that the crossover take place, and two, that the study already be in the 80-100 zone. In the example below, the symbol SPY met both of these criteria, which preceded the massive sell-off in prices early in the year 2020.
Likewise, a trader might require for a “Buy” signal that the study be between 0 and 20 and that a positive crossover take place, as was the case below with SPY when a major market bottomed was reached, also early in the year 2020.