Surely one of the most dramatically-named technical indicators of all time is the Ultimate Oscillator, developed by famed commodity trader Larry Williams. The indicator is designed to offer buy and sell signals based on trend divergences.
A bullish signal, for example, exists when these criteria are present:
- Although prices are still trending down, the oscillator is trending up;
- The oscillator has recently fallen below 30;
- Finally, the oscillator has made a “higher low” and, upon its next ascent, pushes above the most recent high (in other words, a pair of higher lows and higher highs is in place)
- Once the oscillator pushes above 70, the “buy” is considered closed
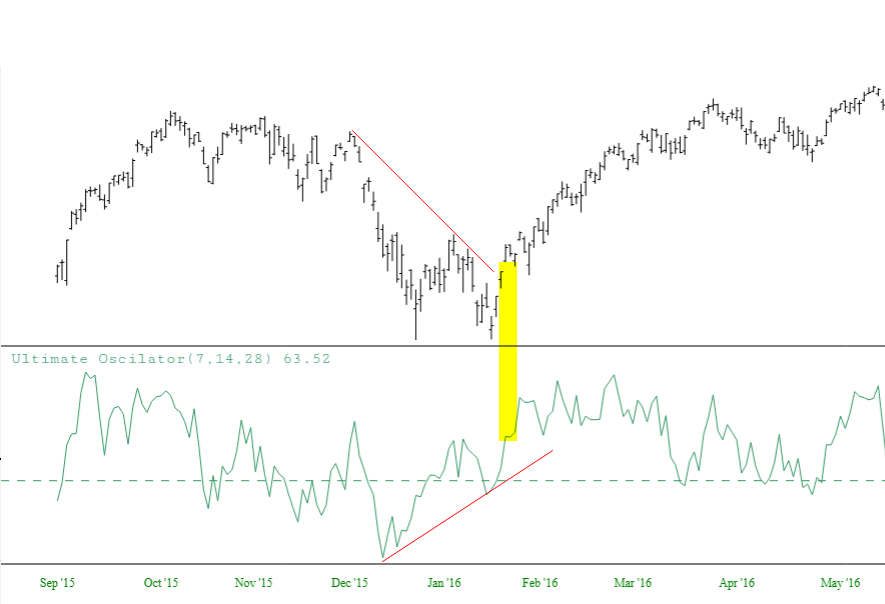
Below is a visual example of a buy signal, recorded for the popular fund SPY. Red trendlines have been drawn to highlight that although the price was in a downtrend, the oscillator was in an uptrend. When the ultimate oscillator crossed above its prior high (tinted in yellow) a firm ascent in price was signaled.
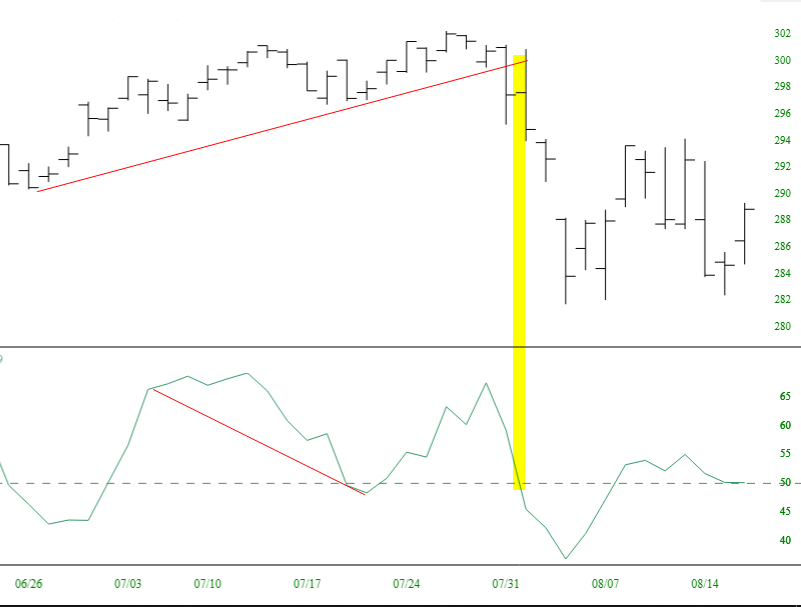
Conversely, a bearish signal is shown below, also for the SPY. The prices (top portion) are in an uptrend, yet the oscillator is trending lower. The prior low is exceeded (yellow tint), which precedes a breakdown in price.
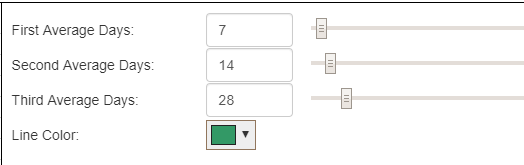
As with other indicators, the parameters are provided with slider bars, so you can easily experiment with different settings, but most users will find the default values satisfactory.