The Parabolic Stop and Reversal (PSAR) is an advanced stop-loss strategy that combines time, price and volatility characteristics into one indicator. It’s an excellent tool for traders that can be used in conjunction with other tools like trend lines, Fibonacci retracements, Bollinger bands, and more.
What Is The PSAR Indicator?
Parabolic Stop and Reversal (PSAR or Parabolic SAR) is a technical indicator developed by Welles Wilder for determining trend direction and potential reversals in price. This trailing technical indicator uses a stop and reverse method to identify potential exit and entry points for traders.
The math behind the PSAR is beyond the scope of this overview, but there are excellent articles with deeper information on it here and here.
On a stock chart, a PSAR indicator is added simply as a series of dots above or below the asset’s price. The PSAR dot is placed below the price when it is trending up and flips so that the dot is above the price when it is trending down.
How To Use Parabolic Stop And Reversal?
PSAR is often used as an indicator for when to enter or exit a position in a security. This is especially effective for traders setting trailing stop loss orders.
PSAR is an indicator that is most effectively used on financial instruments that trend for long periods of time. In other words, a stock or fund which tends to move without any clear “up” or “down” direction will produce many false signals with this indicator.
It is worth noting that the Parabolic SAR and Moving Averages can both be used for tracking price and helping show its trend, but approach this through different formulas – which result in different trading signals.
SlopeCharts Guide To Using PSAR Indicator Tool
SlopeCharts includes a Parabolic Stop and Reversal indicator tool for users to overlay onto their chart. By way of example, here is Alphabet, Inc. (GOOGL) with a PSAR overlay. The Parabolic Stop and Reversal is shown as a series of dots which are either above the price bars or beneath the price bars.
If above, the PSAR is suggesting a downtrend in that stock, and these dots will “flip” to the other side if the trend likewise flips. In this instance, the highlighted area shows where the stock flips from downtrend to uptrend.
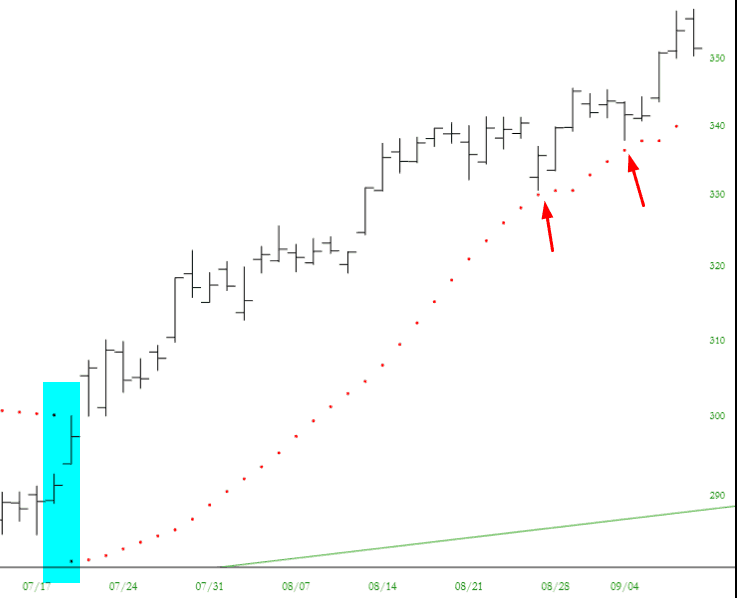
The red arrows in the chart above highlight points where the price “threatened” to break the Parabolic Stop and Reversal but instead found support. So long as prices do not violate the PSAR, the dots will remain on the same trend side. Otherwise, they will flip to the other side, reversing the trend. As suggested, financial instruments that lack trend will have this “flip” take place so many times as to be useless.
Besides setting the color of the dots, you have two other points of control – the Acceleration Factor and the Maximum Acceleration. The suggested values are set by default, but you can alter these to make the PSAR more sensitive (and thus more volatile). Higher values (such as .04 instead of .02) will increase sensitivity while lower values will have the opposite effect.

