As the name implies, the Stochastic RSI is a combination of the Stochastic Oscillator and the Relative Strength Index (RSI) indicators. When you choose Stochastic RSI (StochRSI for short) from the Technical Studies dialog box, you have two controls: one which adjusts how many periods are used in the calculation (the default being 14 days) and the color controlling the color used for the line in the StochRSI pane.
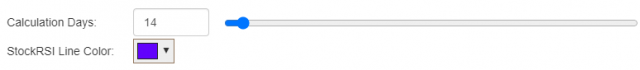
If you move the slider, you can see the effective on the indicator output immediately.
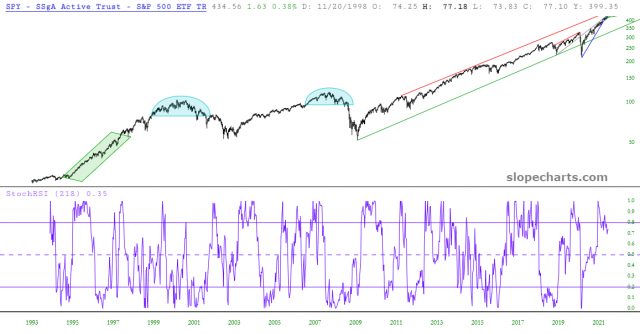
Here, for example, is the StochRSI with a 218-day period (which produces much fewer signals than the 14-day default does). And the “signals” are typically interpreted as overbought and oversold. Specifically, when the StochRSI crosses below and then above the 0.2 mark, it is considered to be emerging from an oversold condition, and, conversely, crossing above and then below the 0.8 mark is considered to be emerging from an overbought condition.
Here is a specific example using the symbol SPY and the 120-day StochRSI. The “sell” signals are tinted with magenta, and the “buy’ signals are tinted with green.
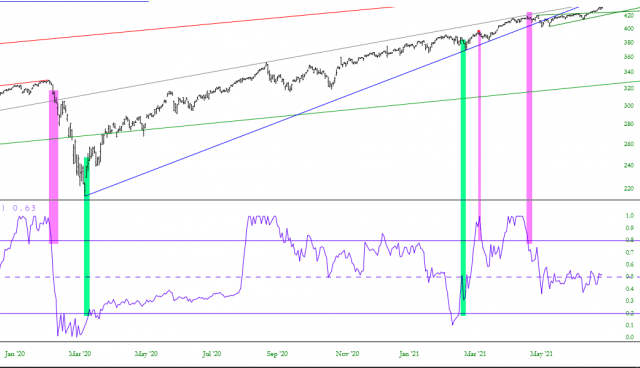
Of course, one should never slavishly assume that such crossovers guarantee profitable trading signals. Far from it. As with all technical indicators, the StochRSI can be a useful way to inform you as to the subtle behavior of a financial instrument and, collectively, sets of indicators can be used to draw a rational conclusion about what is more likely to happen in the near future than not.
