Where is the market heading – a different point of looking at things
Many of us ask, where are things going, are we at the bottom, are we reversing from here – – at least myself. I only really do bi directional strategies at this moment, meaning always working hedged for the next surprise, straddling CPI reports with leveraged ETFs and other tricks like that.
At the same time I hear many different points of view of where the bottom will be. From many I hear 350, from some 320. So I tried to find something I can reason with along these lines.
First of all, the bottom will be around that point when we hear that some people (which most of us know here as the Federal Reserve) start their printers up again and when we get a bit more an economy oriented government. The later may take two or more years, the first we don’t know.
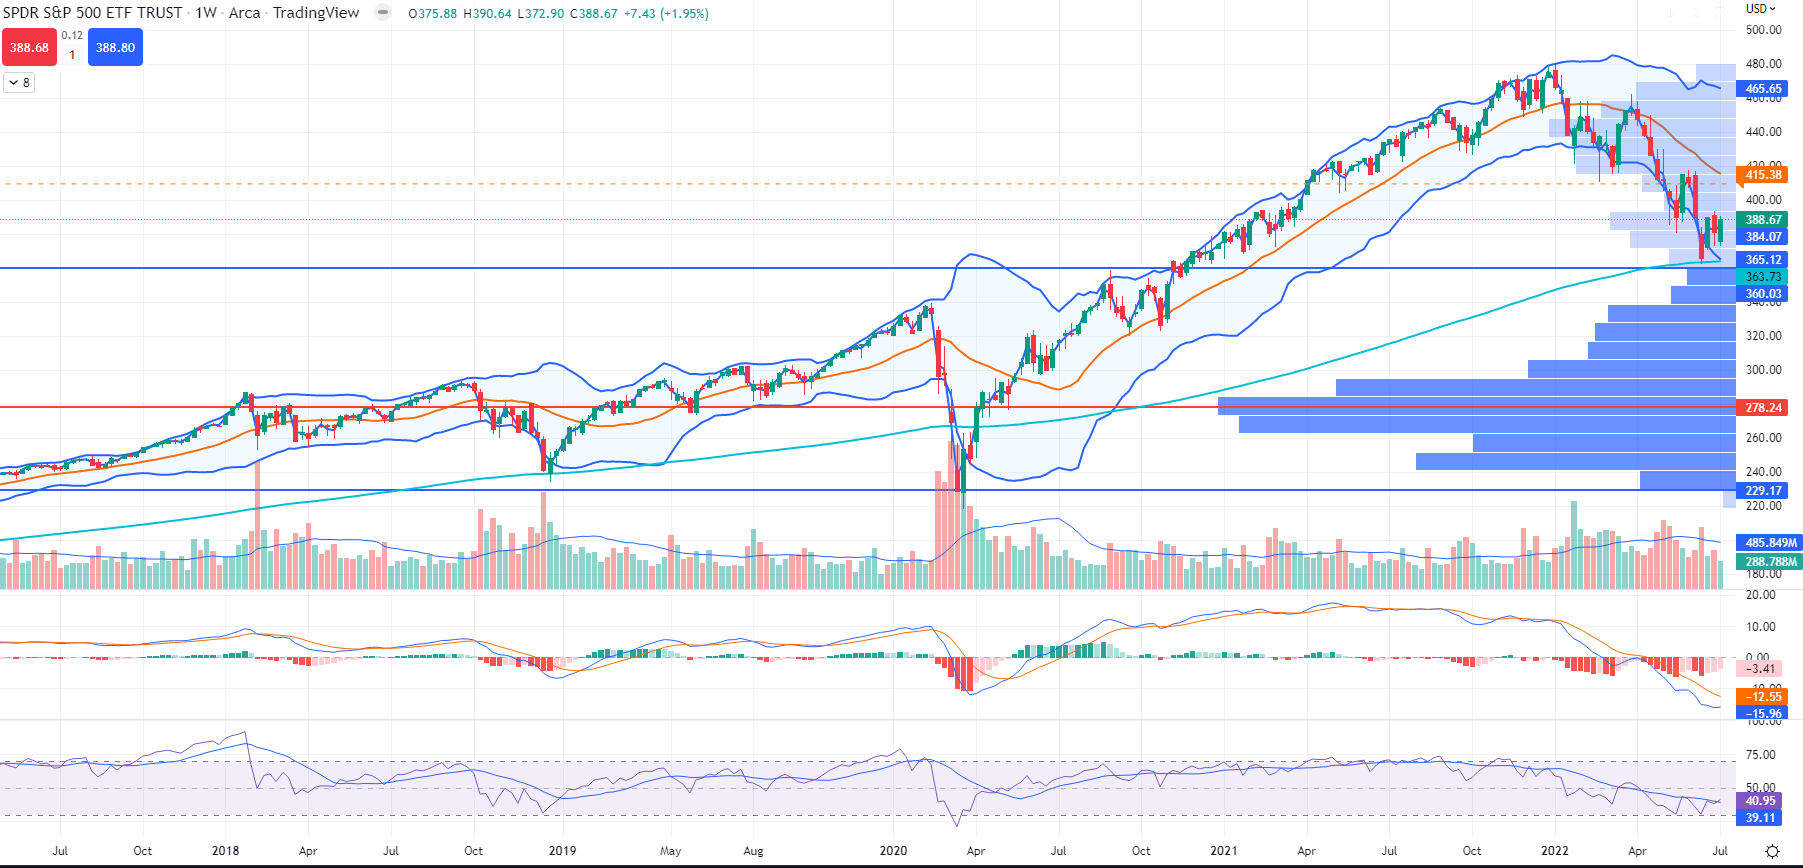
Now to where I think the bottom might be, using Volume Profile and then a bit of near, mid and long term analysis based of that. Below the weekly SPY chart with a Visible range Volume profile, VP, MACD, RSI with MA. Going 4 years back:

The first interesting point is that on the EMA 200, we have not broken through yet. Only in the depth of the fake COVID bear market we actually did that and likely in older crisis like GFC too (I didn’t check to be honest). We are also sitting right on top of VAH. The EMA 200 as well as the VAH are likely to be heavily contested but an interesting aspect is that we are not sitting on historically huge Volume, so a push through to 343-350 upon a bad catalyst is quite quickly possible. Yet there is also not so much holding back on the upside so moving back to 405-415 is also quite possible.
Now if we move up, there is big resistance (High Volume Areas) in the way at around 415 and up. If we move down, the 340 level could be contested for a while. We are close to a coming catalyst (CPI), so let us see how it plays out.
Now where will things go from there. If price reenters VA, it typically trends towards POC and bounces from there, if it breaks POC it goes usually for the opposite end of VA. POC is right at 278. This is e.g. aligned with some of Ask Slims April predictions.
Some terms and basics can be found here.
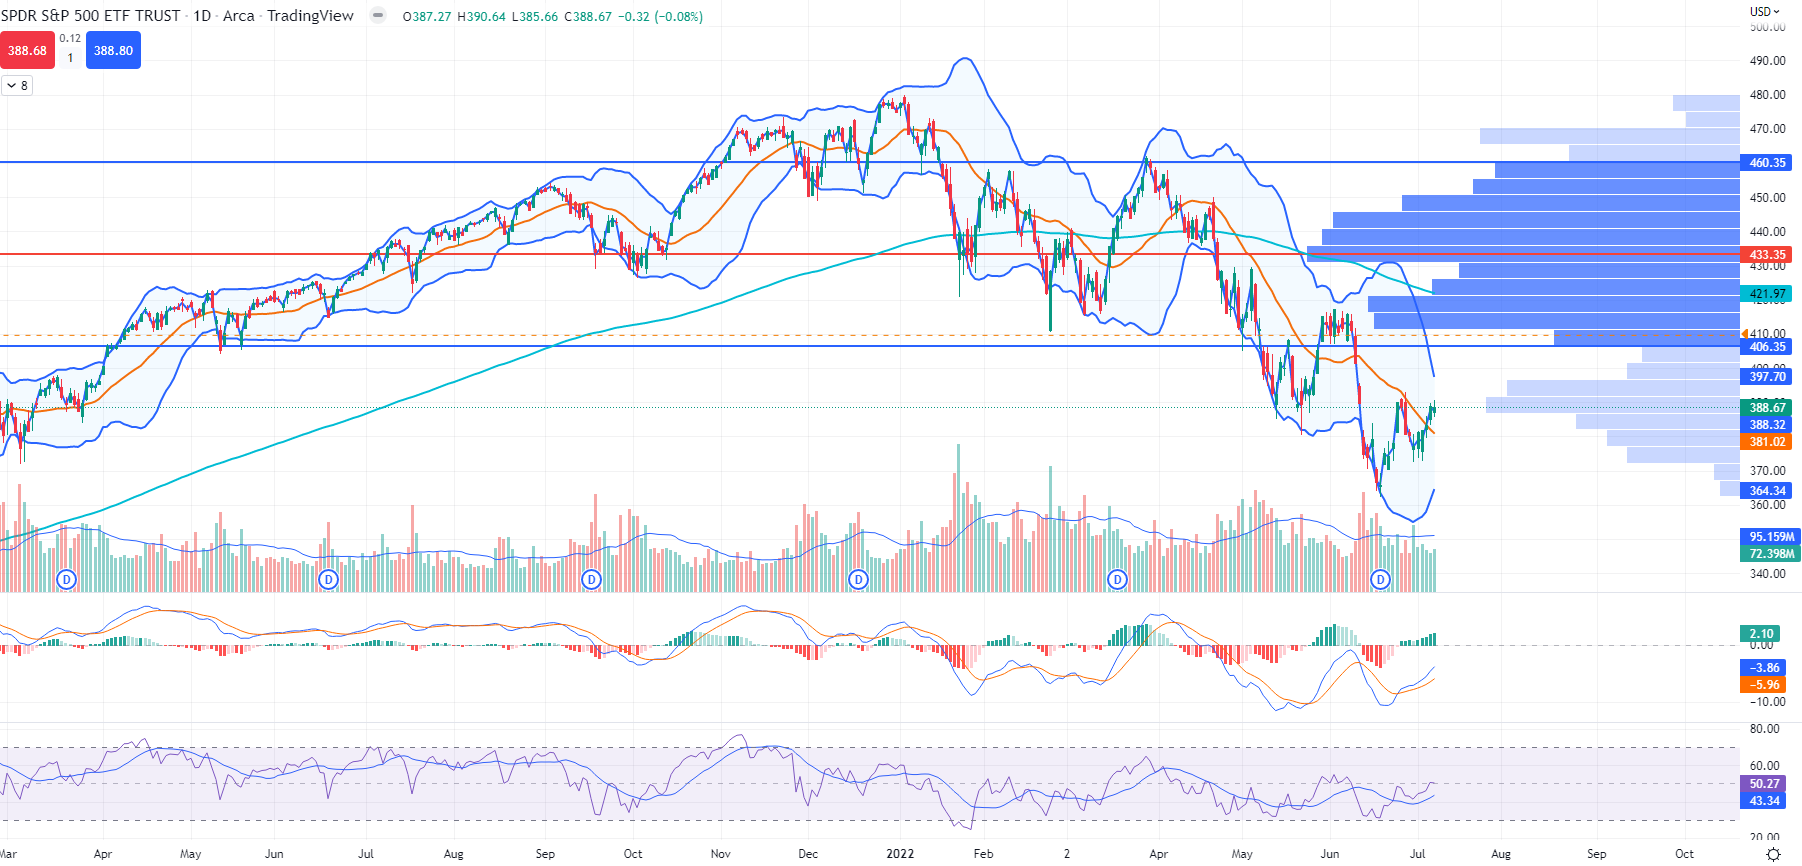
Some near term strategic thoughts (SPY, daily same indicators and hourly, same indicators):


On the Daily we see the W and we see the break through the 20 MA (Inside the BB). There is some resistance in the way (HVNs) but VAL is not out of reach. At the same, there is not much to back things on the downside so if there is a bad news cycle we may fall hard and fast. The first significant support is the POC at 377.
I personally think before CPI some bi directional positioning is wise. Some TLT calls, some TQQQ straddle placed on Wednesday, maybe some VIX calls will make a decent setup.
If you are downside heavy then I would for sure put an upward hedge like SQQQ calls. None of it much more than 2 weeks out in expiration as this is just to make some money during CPI which may help drive direction for the next weeks. Also none of it more than what you are willing to lose. Some targeted stocks that are due for or are in a reversal can be good as well as hedge. E.g. SSRM, MU… Those all show good upward potential. With all of those I would propose to run tighter stops. E.g. conditional orders (If stock goes above N sell contract C). Risk management is key.
Some mid term strategic thoughts:
Mid term if we have a bad news cycle and set to break VAH and EMA 200 on the weekly I think it could be a good point to go very decisively into bearish. Here I consider having even a few longer term ITM options on a few of the index ETFs like QQQ, IWM, SPY, so almost HODL 😉
A good middle ground as always is swing trading where you minimize exposure and optimize for shorter term gains.
Good luck this week! 🙂

