OK. Friday was a rough day. It feels like we were on a road trip. We finally hit the road, a few speed bumps along the way, but we finally hit the highway and started to pick up speed. “Hey, we are making great time! I think we have a few miles of open road ahead of us!” Then we heard some thumping noise and we have to pull over. That was Friday.
It sucks, but we need to check things out. It doesn’t mean the road trip is cancelled. So it’s time for a look under the hood. Is everything ok? Can we continue our road trip now?
So I started looking at the broad market charts, but more at how individual stocks are affecting them. I found something interesting (to me at least) in that both Nasdaq and S&P 500 have the same top 4 holdings, AAPL, MSFT, AMZN, and TSLA. Furthermore, these 4 stocks are weighted so they make up about 20% of the S&P 500 and 36% of the Nasdaq, despite the fact that S&P 500 is really a basket of 500 stocks and the Nasdaq is 100 stocks. So really, what bodes well, or ill, for these 4 stocks bodes similarly for the rest of the market.
Broad Market Index Chart Analysis
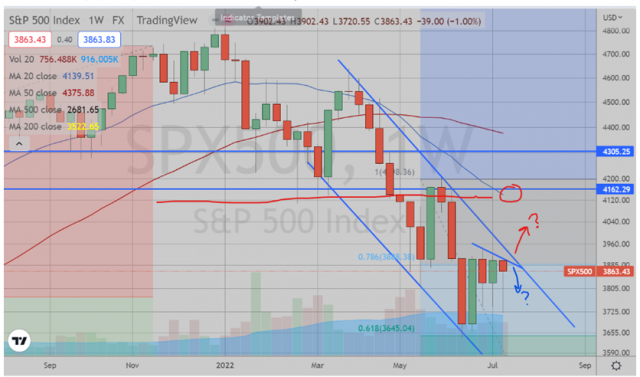
SPX: The top 10 holdings make up 30% of the S&P 500, top 4 holdings make up 20% (AAPL 7.09%, MSFT 6.05%, AMZN 3.74%, and TSLA 2.75%). I am watching the descending channel on Daily/Weekly chart. The High end of channel from March 29 highs, Low end of channel from May 12 low to Jun 16 low.
While Friday definitely showed support still exists at 3840, this does not mean Bulls have won (I think the cheering bulls are a bit premature). They won the battle, not the war, etc, etc. The Weekly chart shows attempted support, potential to breakout upwards.
A break of upper channel would be disastrous short term for bears. I would exit (or severely hedge my short positions) and look for resistance possibly back up near 4100-4140 (previous consolidation, weekly 20 EMA to get back short heavily for medium-long term.
Until that descending channel resistance breaks, however, I remain steadfastly bearish short term. For my bearish case to still hold water, I would love to see (a) direct drop next week, or (b) small attempted pop up to 3900-3920 at the Daily 50 EMA and that descending channel overhead to then reverse.
SPX Daily chart:

SPX Weekly chart:
Nasdaq
This is a large basket of stocks like the S&P 500, but just 100. Still, the top 10 holdings make up 50% of the index while the top 4 make up 36% (AAPL 14.29%!!, MSFT 11.29%, AMZN 6.79%, TSLA 4.39%). The chart for this index is interesting because the Nasdaq fell further than the SPX from the peak, yet shows a stronger bottoming pattern. Peak to trough, the Nasdaq’s recent low wasabout a -34% drop while the SPX was only about a -24% drop. The Nasdaq 100, however, shows higher lows off the bottom while the SPX breached the previous low this past week. Something smells fishy. First, the daily close Friday right at the Daily 50 EMA still holds some sway going into Monday. Even if we pop, I can see a wick forming and closing back beneath that level to maintain the integrity of resistance at this moving average. The previous high of 12185 would need to hold if we are to continue to consider that resistance. If we breach that, I think this has potential to bounce to the weekly 20 EMAup around 13000.
Nasdaq Daily chart:
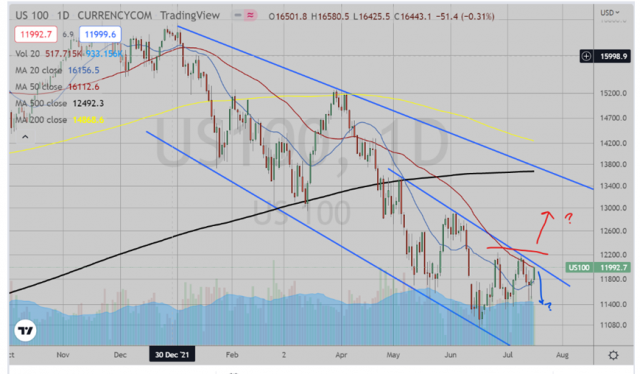
Nasdaq Weekly chart:

Individual Stock Analysis for AAPL, MSFT, AMZN, and TSLA:
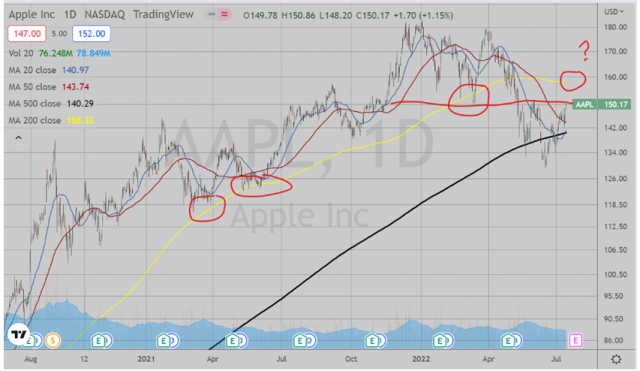
AAPL – AAPL is obviously strong. It did not become the darling of the investment world by simply squeezing shorts (a la GME). An important technical level on this chart is the close Friday exactly at previous resistance in June as it was also previous support in March. So, we are at a crucial spot here. However, I think a break above would still have to contend with the 200 Daily EMA. This EMA proved as crucial support in late 2021 as well as March-May 2022 before it broke below in June. A break above 150 might be a bear trap to retest the underside of that moving average for a final rejection back down. The 200 EMA is only about 5% higher than where the stock is now, so this is certainly a plausible scenario. AAPL earnings come out Thursday 7/28, so we might see that bull trap pop and drop scenario play out (though I would rather not see any more pop).
AAPL Daily chart:
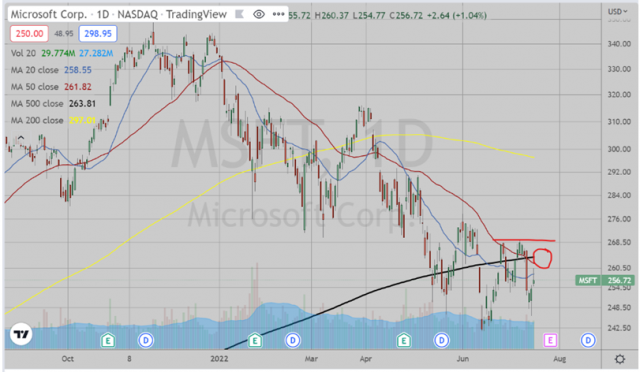
MSFT – Not as strong as AAPL. The weekly chart shows a close with a lower wick meaning support held, but this is certainly not the epitome of bullishness to start a reversal. Resistance at 270 looks very strong. The daily chart doesn’t look much better as it is holding fairly strongly beneath the daily 50 EMA. This is a weak looking chart. MSFT earnings come out Tuesday 7/26.
MSFT Daily chart:
MSFT Weekly chart:

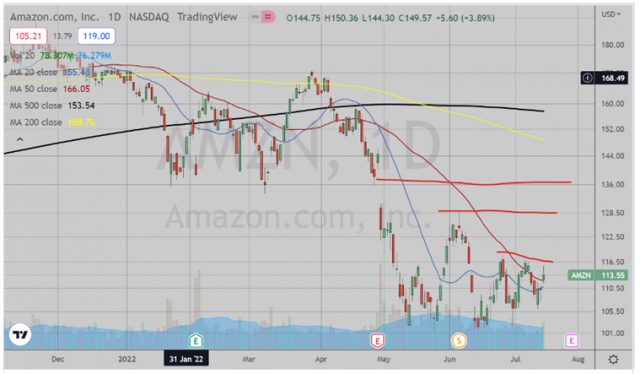
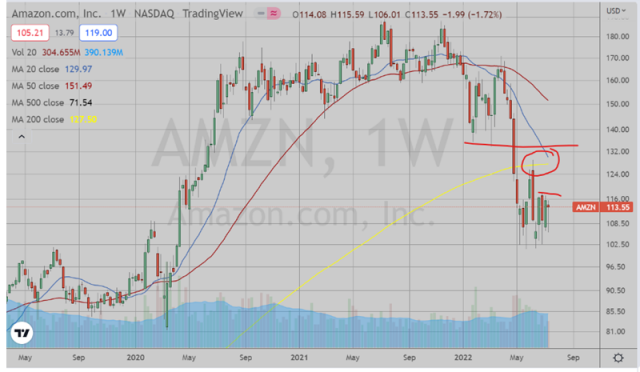
AMZN – This weekly chart looks weak. It is far below the daily 200 EMA, nowhere near previous high resistance in June. If a break above happens, I’d look for that previous resistance to hold as it also lines up with the daily 20 and 200 EMAs. The daily chart has a hint more bullishness as it is trying to break out above the Daily 50 EMA. But again, overhead resistance looks like big obstacles to hurdle and look more like shorting opportunities even if bullish in the short term. Earnings come out Thursday 7/28, same day as AAPL.
AMZN Daily chart:
AMZN Weekly chart:
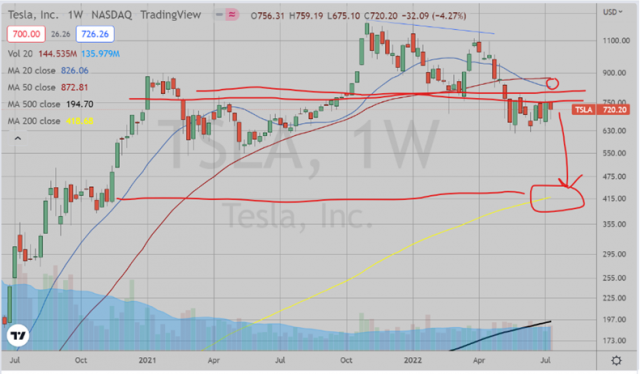
TSLA – The weekly chart looks like it is BEGGING to be cut in half. 750 resistance is incredibly strong. Again, while we ended last week with a bullgasm “huzzah” cheer, I think it will be short-lived. At best, a pop into overhead resistance into the weekly 20 EMA looks like a great spot to get back short. The daily chart, like AMZN, looks like it is trying to be bullish and breakout above that daily 50 EMA. It smells like a bull turd, I mean trap (Freudian slip!).Earnings come out this Wednesday 7/20.
TSLA Daily chart:

TSLA Weekly chart:
Back to broad indexes: Given the fact that these are heavily weighted to these 4 stocks seems a bit top heavy to me. Given the bottoming pattern looks stronger in Nasdaq than the S&P 500 tells me that the tech stocks are getting a lot of bullish attention, mainly led by the four stocks described above. Any weakness in these would tear that bullish argument to pieces.
To summarize, weakness in the markets have persisted but not thrived just yet. Bulls are calling the bottom because we haven’t dropped yet, which to me feels like cheering because your fighter took a shot to the nuts without puking (he’s so tough!). The main drivers of these indexes are heavily weighted and only 1 of those 4 really look like it still has some bullish potential (though not much). I obviously could be wrong, that’s why it’s all speculation. But my money is there on the line. As always, GLTA in your trading.

