
In my last two posts I’ve been talking about the possible short term topping setup here on equity indices in the context of the historically reliable daily sell signals fixed but not yet made target still on SPX and Dow.
In the first of those posts I was talking about the possible H&S patterns that might form, noting that if they failed to complete and break down then the prior highs would likely retest, giving a second shot at a high setups with double tops.
In my last post I was looking at the decent quality H&S patterns that had then formed on SPX, NDX and Dow, noting that to break down below the pattern necklines, all three would need to break back below their daily middle bands. If that didn’t happen I was saying in the premarket video that day that we would likely see high retests on at least SPX and NDX.
The daily middle bands all held and SPX and NDX retested their prior highs as expected. So what now?
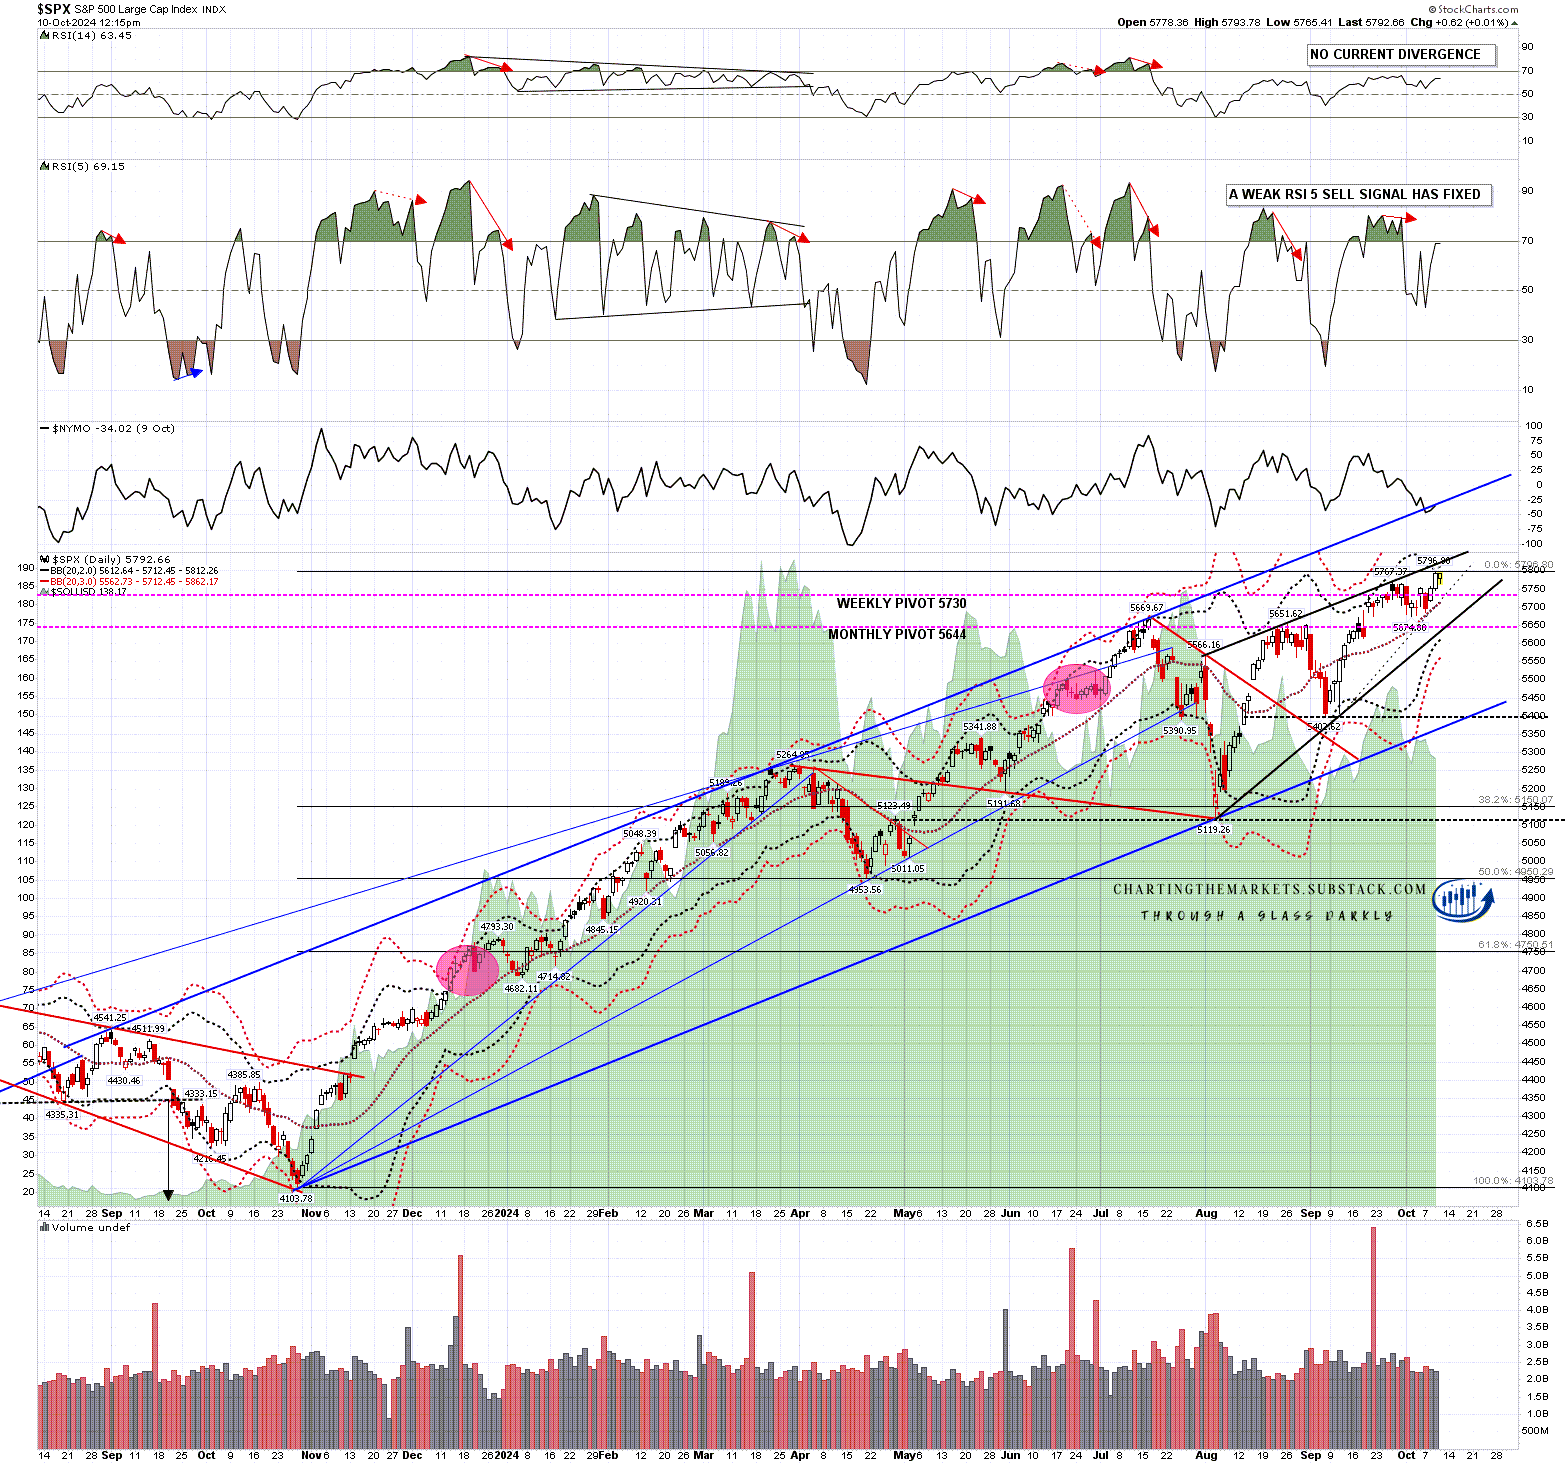
Well we have decent looking double top setups on SPX and NDX, and a slightly lower quality one on Dow as that high hasn’t quite been retested yet. There is some negative divergence on shorter term charts that fixed into sell signals this morning, and there is still two weeks and change left of the obvious downside window into late October, which would be the obvious time to see those sell signals reach target.
How reliable are those daily sell signals? They’re good, but they fail sometimes, and I have a level on SPX which I will be watching, as a move above it will make such a fail a lot more likely in my view.
For context though, there are eight prior fixed RSI 5 sell signals on the SPX chart below, of which two failed. None of those eight sell signals made a conviction break of the prior highs without the sell signal failing, so if we are to see the next reversal, it should be in this area. Equally, if the sell signals are going to fail directly into another leg up, we should be able to see that is likely happening without it going too much higher.
On the chart below there is a high quality rising wedge from the August low marked in black trendlines and yesterday’s high at 5796.90, was just under 30 handles higher than the prior high at 5767.37. The next obvious target would be wedge support, currently in the 5640 area, and wedge resistance, not currently an obvious target, is now in the 5825 area. Any significant break of that wedge resistance trendline is likely a break up in my view, with the obvious target then at overall rising wedge resistance from the Oct 2023 low, currently in the 6050 area.
SPX daily BBs chart:
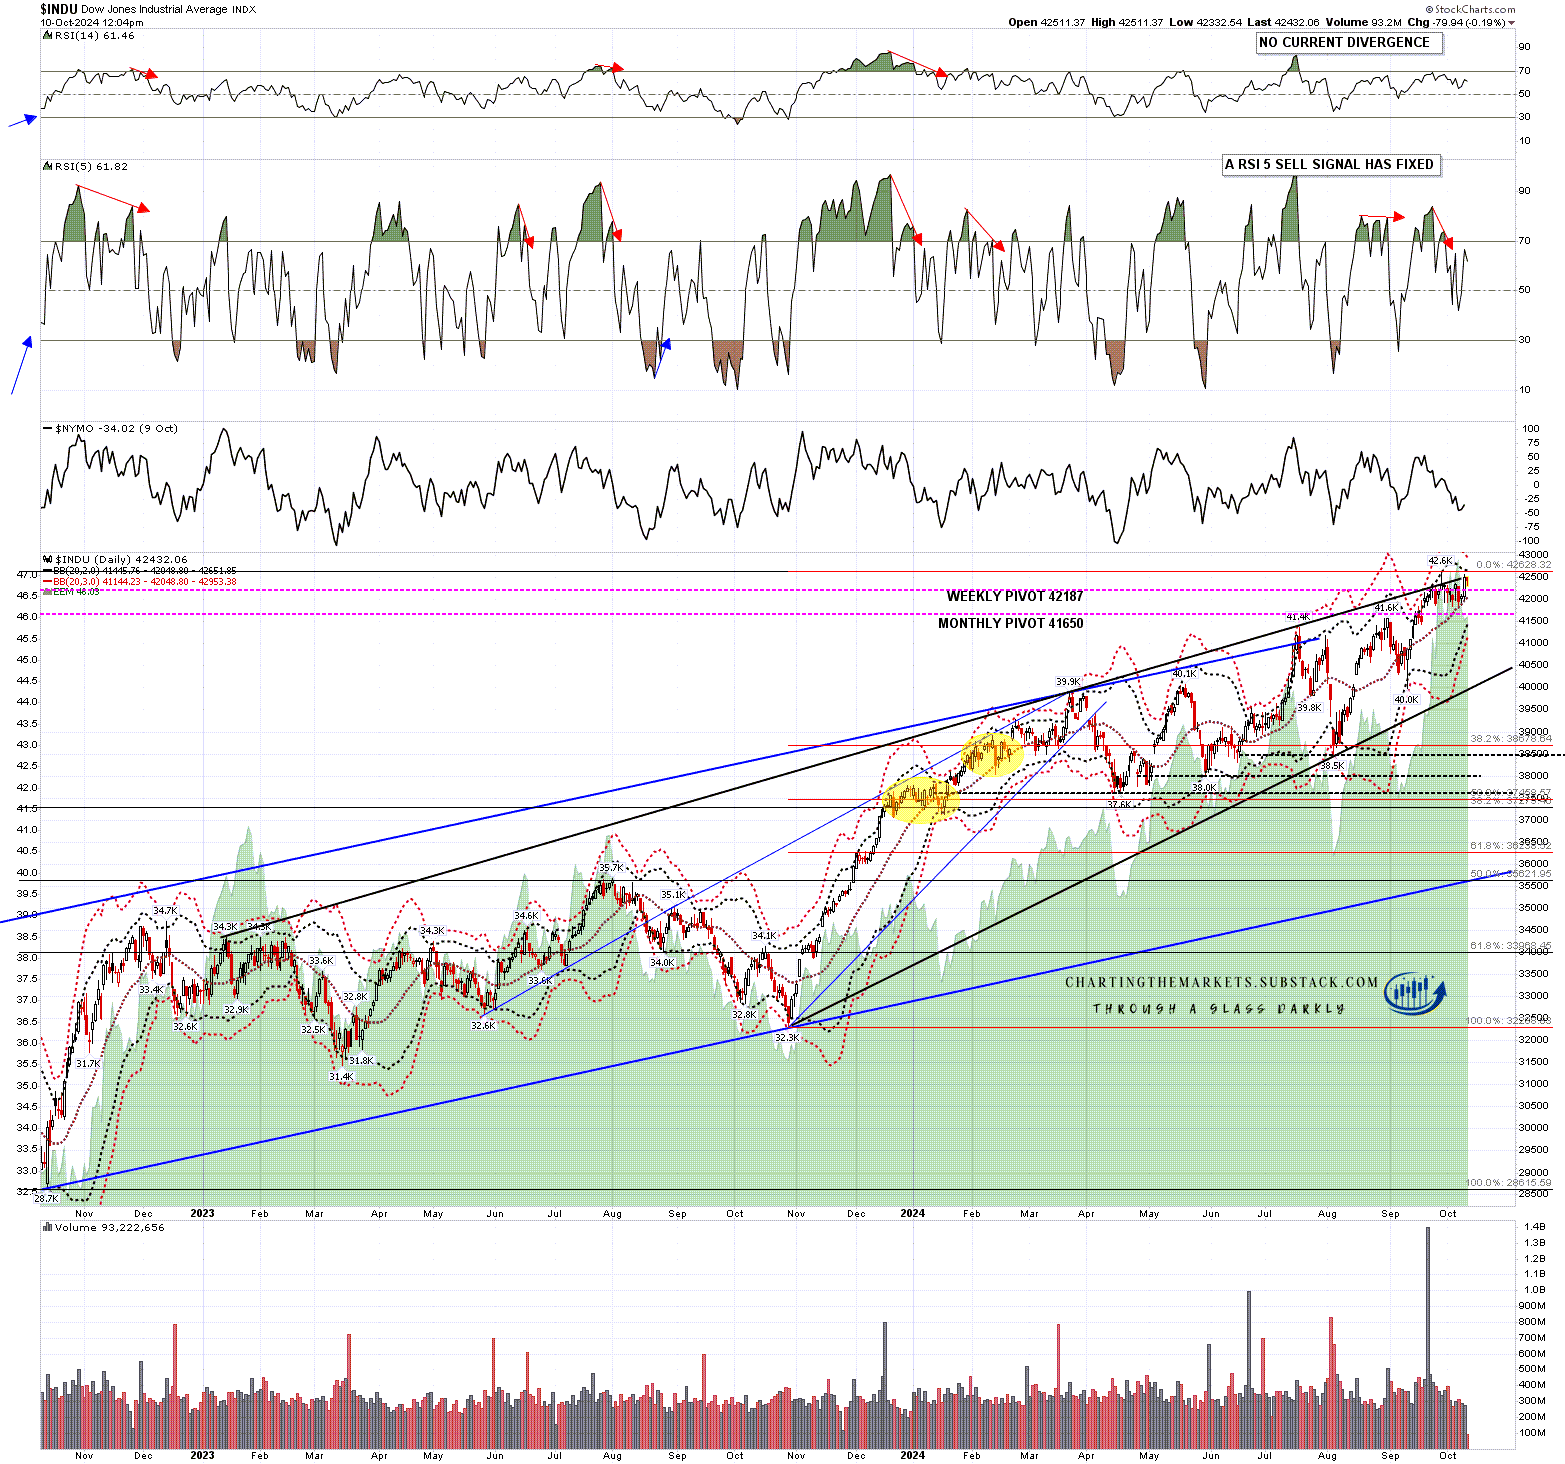
Key resistance on the Dow chart is not as easily seen, but I would note that there have been six previous daily RSI 5 sell signals on this chart in the last two years, and all of those made target. Until we see strong signs that equities are breaking up, the odds still favor this reaching at least the minimum near miss target at 35 on the daily RSI 5.
INDU daily BBs chart:
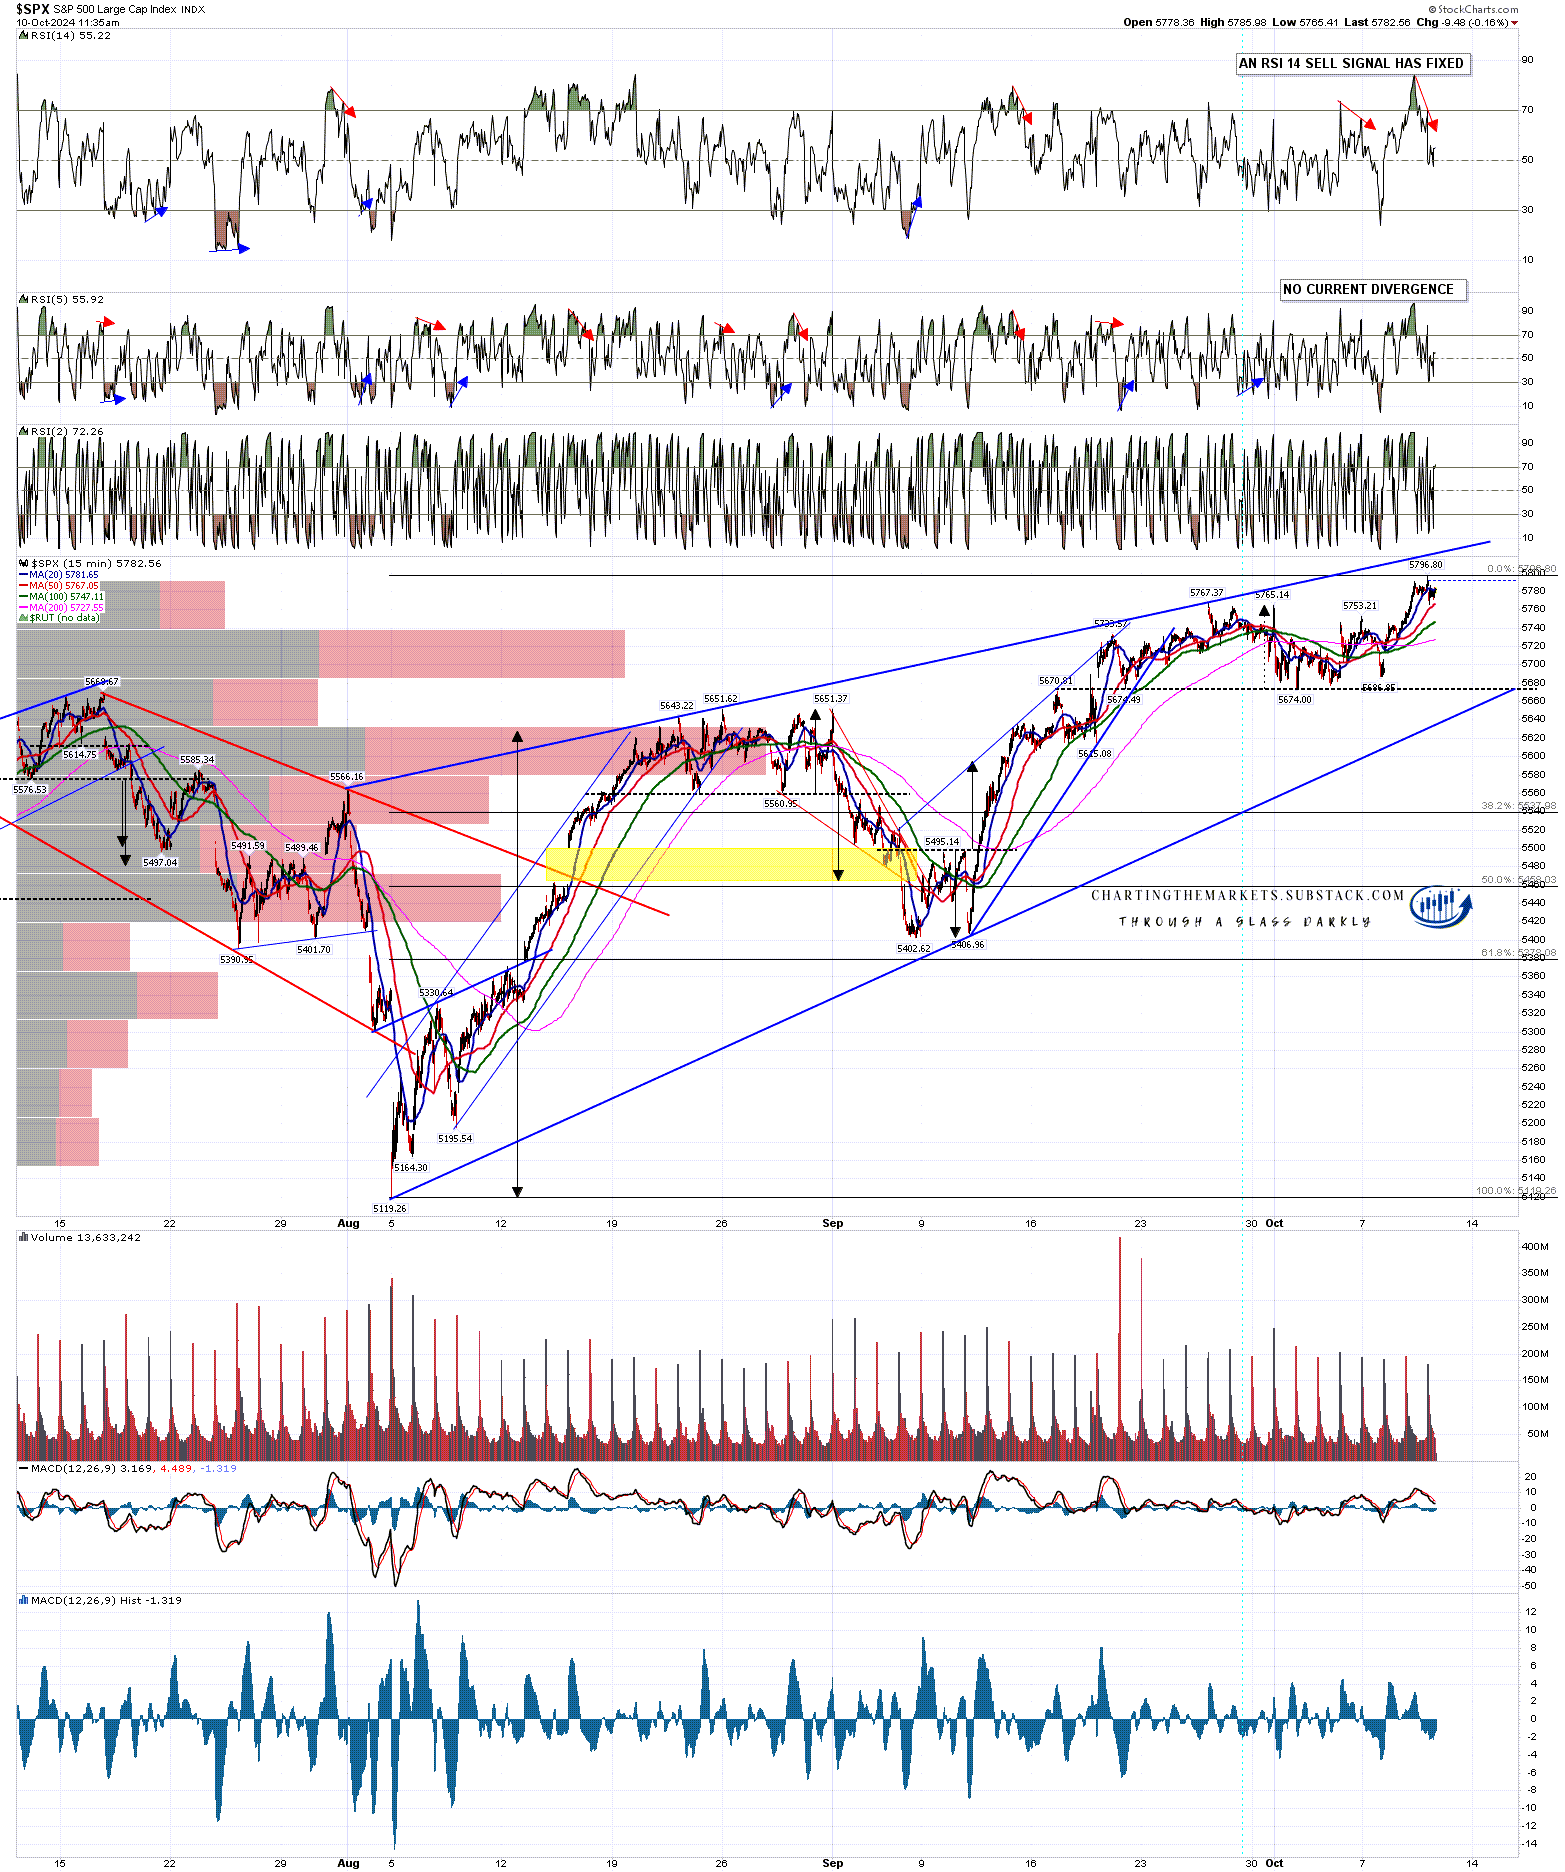
On the SPX 15min chart, an RSI 14 sell signal fixed this morning, as well as an hourly RSI 5 sell signal and another hourly sell signal on ES Dec. Daily middle band support is currently at 5712, and on a sustained break of that and possible double top support at 5674, the double top target would currently be in the 5550-85 range.
SPX 15min chart:
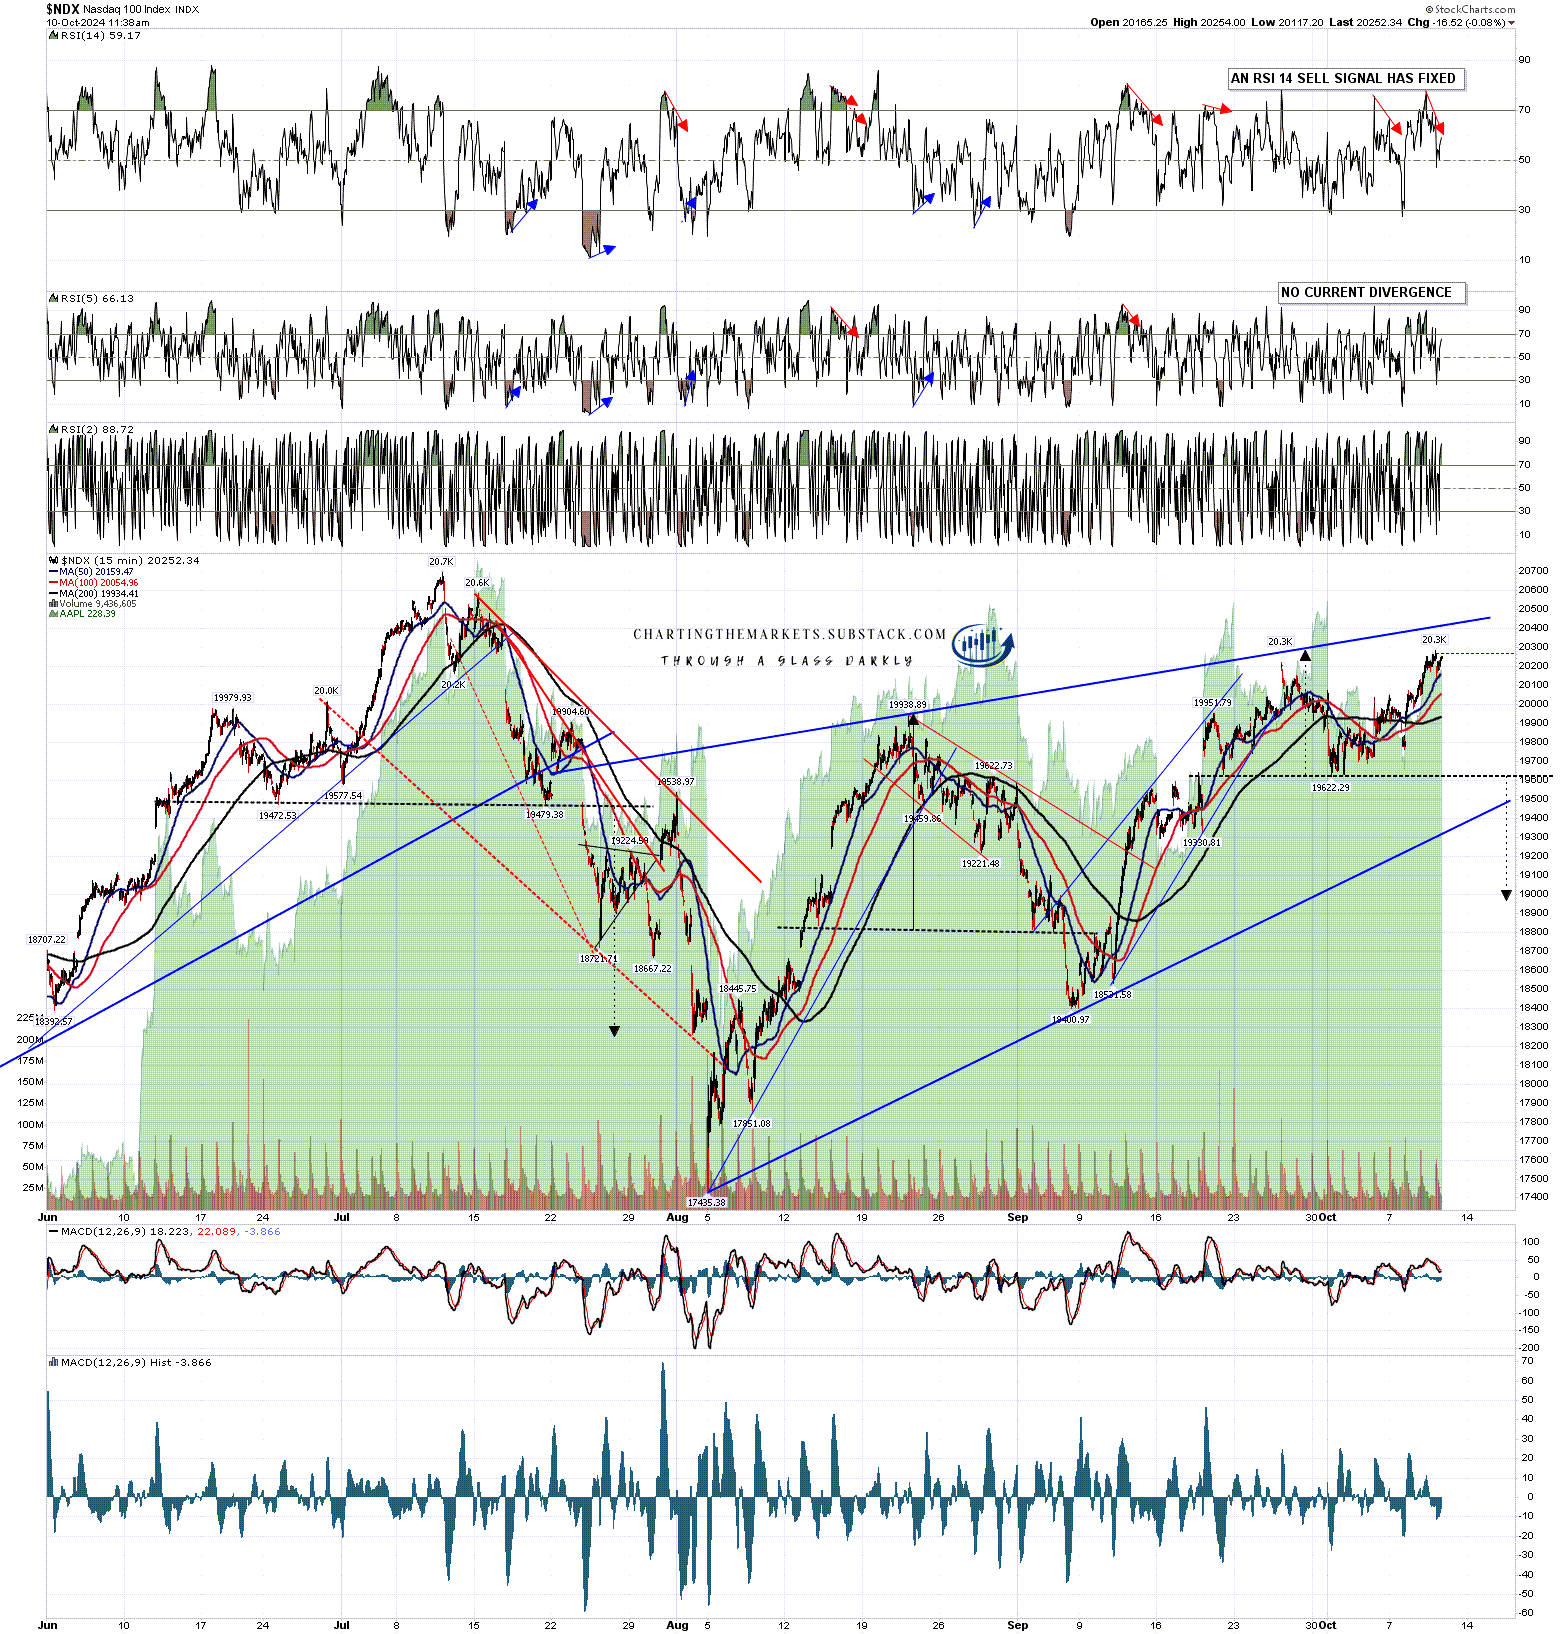
On the NDX 15min chart, an RSI 14 sell signal fixed this morning, as well as an hourly RSI 5 sell signal and another hourly sell signal on NQ Dec. Daily middle band support is currently at 19815, and on a sustained break of that and possible double top support at 19622, the double top target would currently be in the 18950 area.
NDX 15min chart:
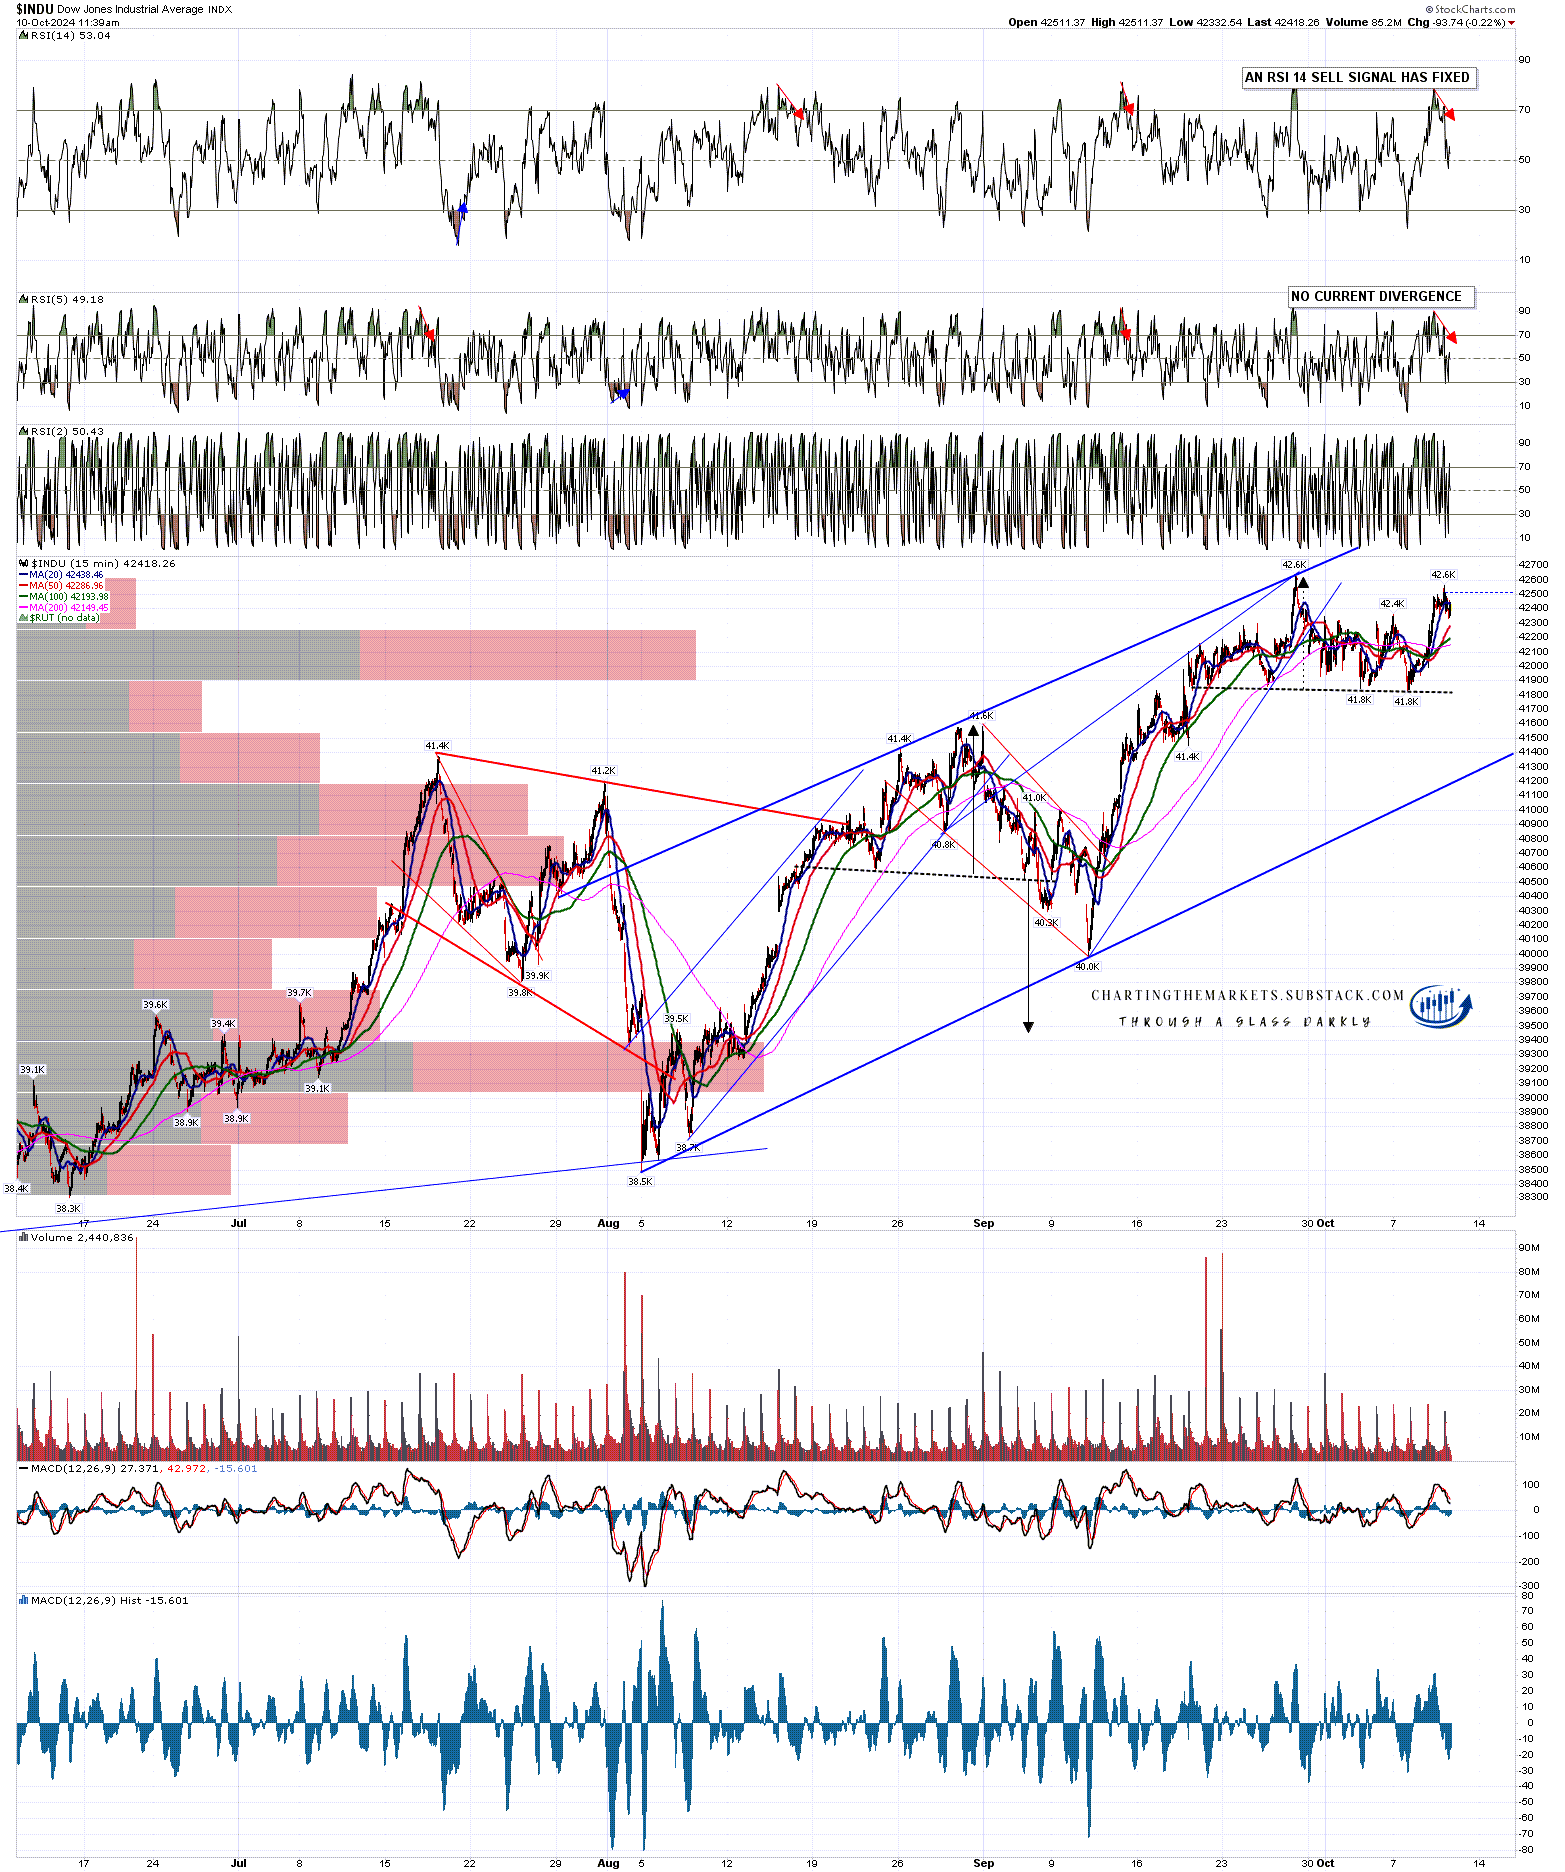
On the Dow 15min chart, an RSI 14 sell signal fixed this morning, as well as a weak hourly RSI 5 sell signal. Daily middle band support is currently at 42049, and on a sustained break of that and possible double top support at 41.8k, the double top target would currently be in the 41k area.
INDU 15min chart:
Whatever happens, a seasonally weak window is in the process of closing here. In the absence of news driving markets the other way, that window closes by the end of October and November and December will likely belong to the bulls. If we do see a significant retracement here, it is most likely a long entry.
If you like my analysis and would like to see more, please take a free subscription at my chartingthemarkets substack, where I publish these posts first and do a short premarket review every morning.
