SPX, NDX and RUT have been rallying as expected, RUT made a new swing high first on Friday, NDX has made a new all time high today, and SPX has come within a few handles of the ATH retest but no cigar as yet.
I want to talk about the trendline resistance that I’ll be watching over the next two or three weeks during this likely bull window. The daily bollinger bands are so compressed that we could see a break up through these trendlines, or possibly see a break down before the cycle high window opens. The daily bollinger bands average about 3% to 4% between the upper and lower bands on the daily, and anything under 2% is compressed, and anything under 1.5% is very compressed. SPX is now at about 1%, at a degree of compression that has not been seen before in many years, and possibly never seen before at all. This is likely to resolve into a decent expansion, which should be downwards, but could be up. If it is going to be a break upwards then there are two important trendlines to watch.
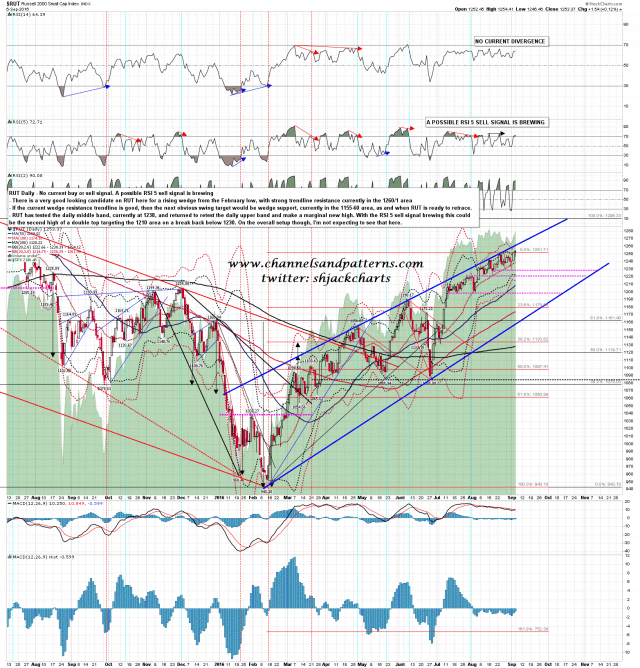
The first of those trendlines is on RUT, and that is a very well established likely rising wedge trendline. That’s a strong trendline, but if it can be broken then there is a very obvious target not far above at the retest of the all time high at 1296. I’m leaning towards this trendline breaking, though as I said, it is a very strong trendline, and that might take a few days if seen at all. RUT daily chart:
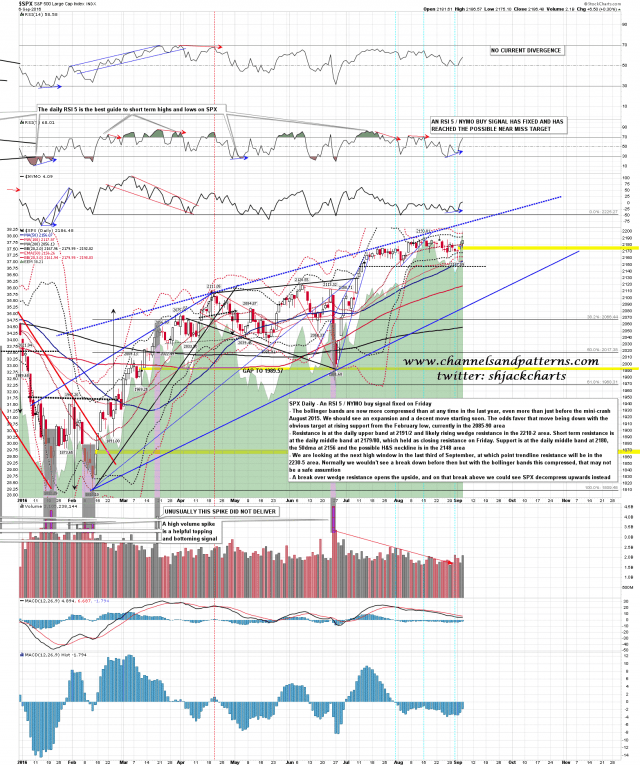
The other trendline is wedge resistance on SPX. That’s not nearly as high quality as the RUT trendline but it’s more likely to survive simply because it’s further away, and there isn’t any really compelling target above it to hit. That’s in the 2210 area now, and will be in the 2230-5 area by the end of September. I think this trendline may well survive, in which case there can be no major expansion upwards in this bull window. If the trendline breaks then I’ll be looking back to the ATH retest of RUT for likely resistance there. If that breaks then the remaining constraint will be time, as bulls have only two to three weeks here to work with, though if enough resistance is broken in this window, we’d perhaps continue up after just a retracement. SPX daily chart:
In the short term NQ particularly is starting to look a bit toppy here and we may well see a retracement soon, possibly as ES retests the ATH but more likely when NQ retests the new ATH that was made today. That retracement doesn’t seem likely to get far, but then nothing has been getting far in this tape. The obvious support levels on SPX are the daily middle band at 2180 and the 50 hour MA at 2175
Just a reminder that Stan and I are doing an free inauguration webinar after the close next Monday for our new Big Five service at theartofchart.net covering AAPL, AMZN, FB, NFLX & TSLA. We’ll be running the charts on these and showing what the service will do. If you’re interested you can register for that free webinar here.


