All charts and video today done last night or this morning for subscribers at theartofchart.net.
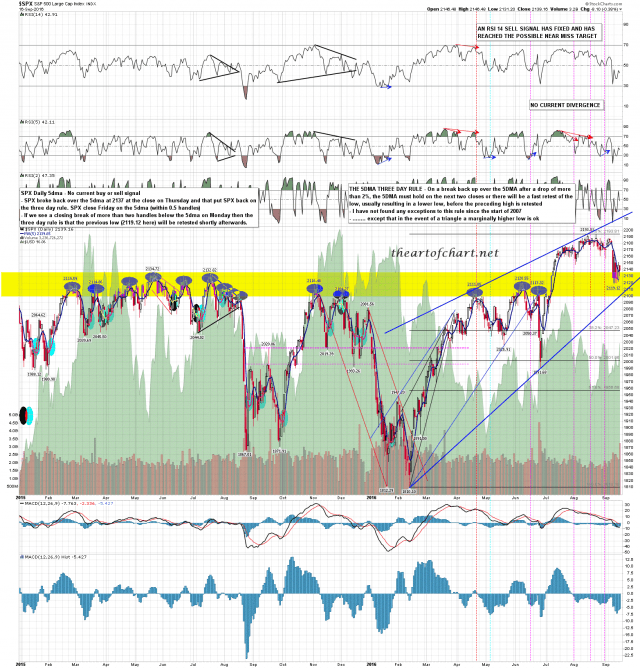
SPX spent much of Friday under the 5dma, but rallied to close on it, so the three day rule was not triggered. Bears have a second and last chance today to close more than two handles below the 5dma, currently at 2138.10. If they can then the rule states that we see a retest of the current retracement low at 2119 and likely go lower. If they can’t then the retracement low may well already be in and SPX likely rallies into the high window that opens on Thursday 23rd September, ideally retesting the current all time high or going a bit higher into the 2210 target that Stan and I are looking at. SPX daily 5dma chart:
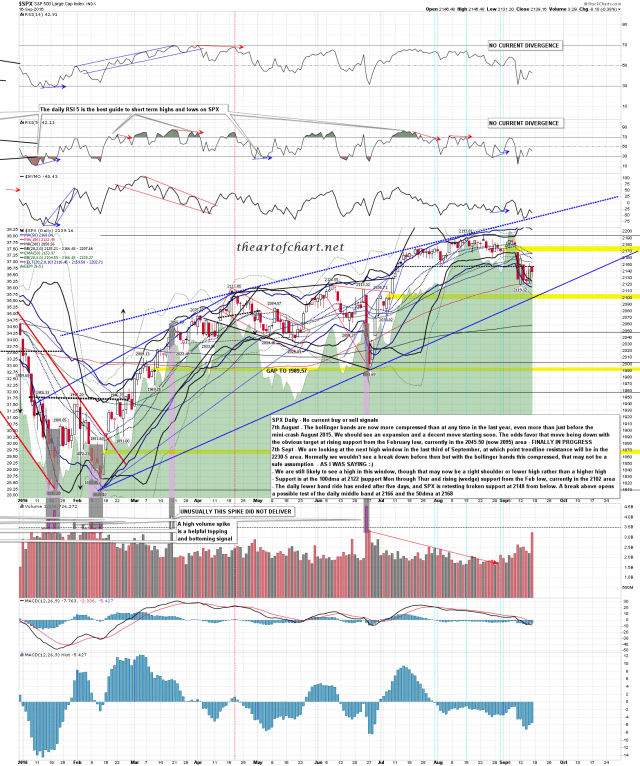
SPX has been retesting broken support from below at 2148 and that’s been holding very well on a daily closing basis so far. If that breaks, and for the short term bull scenario it would obviously have to break, then daily middle band resistance is currently in the 2164 area and the 50dma is currently in the 2168 area and those are both significant resistance levels. SPX daily chart:
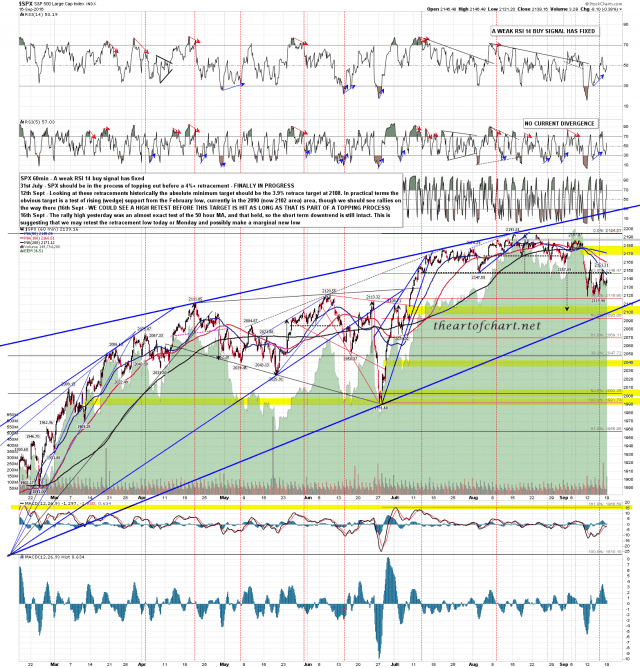
First resistance that bulls would need to convert today though is the 50 hour MA, currently in the 2144 area. That was the high on Thursday, and if bulls can convert that to support and close at or above the 5dma today then the short term bull scenario into a retest of the ATH at 2193.42 will be off to a very promising start. SPX 60min chart:
I’m reorganising my work schedule at the moment to try to produce more timely content for subscribers at theartofchart.net without having too many very late nights, and one thing I’m likely to introduce for the Daily Video Service subscribers is a premarket video every morning. I’m running the trial for that this week and this was the one I did this morning. Very decent hit rate so far. In future when I’m doing an update across the main range of markets that we cover at theartofchart.net I’ll be posting one of these videos rather than the main eight charts they are covering, which are the ES, NQ, TF, DX, CL, GC, ZB and NG charts.
For any of you following the gold long I was playing last week there is an update on that in this video. Premarket Video Experiment:
I like the long side on SPX/ES into FOMC on Thursday this week but there are a couple of reasons to think that it might go the other way on NQ and TF. I look at those on the video. Trade safe 🙂


