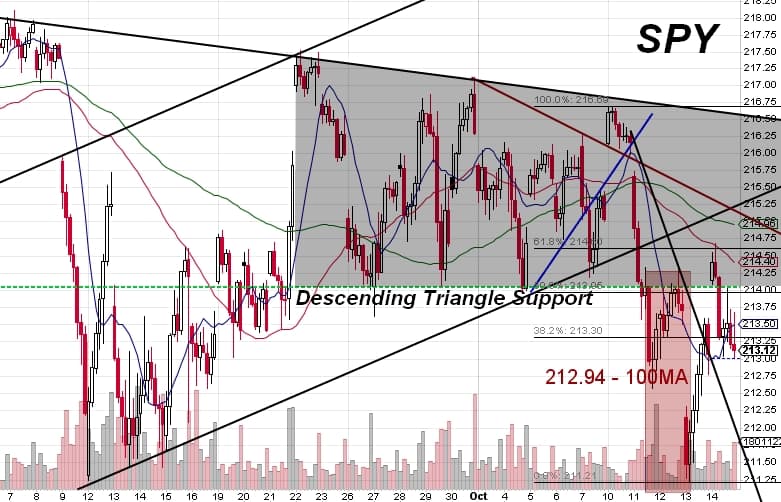
Trade Review: The trade I proposed Monday turned a nice profit for me this week. I had to adjust my entry slightly and I had my profits return to breakeven (and a little underwater mid-trade), but the risk:reward remained the same so I held and it worked out in the end. Here is the time I held the position (in red)
In my Monday post, I proposed waiting either for a test of the upper downtrend line (narrowly missed Monday morning) or on a retest of the channel line if broken (the lowest up-angled line on the chart). The breakdown came swiftly Tuesday morning and I was left with the uncomfortable feeling of having missed my preferred entry and trying to avoid chasing while still finding a low-risk entry point.
I was patient and as price was approaching the lunch hour, price reversed and began to rally. Now that important support had been broken, this HAD to be looked at as a retest of that broken support. Price began to struggle around $214 and I suddenly realized that $214 could be the only retest I was going to get since that was the main support in the chart pattern. I considered entering only a half position, but decided against it in the end.
I waited for the first 5-minute high wick candle (showing sellers coming in) and entered there with a stop on a closing 5-minute bar above it to maintain a small risk rather than letting it rally into channel resistance and watching my position capital dwindle away (ultimately costing me mental/emotional energy, a very precious resource).
To my delight, price fell apart promptly after that and left me at a decent profit at the EOD. Wednesday’s trade continued a rally back into the same resistance where I took my entry which was frustrating. I dealt with doubts and worries by reminding myself that important support had been broken and until resistance was broken, the trend was still down and that my risk was still small and defined (Self-talk: if I get stopped out, I get stopped out, that’s the price of attempting to profit). Thankfully, towards the end of Wednesday’s trade, price began to roll over again. Thursday’s gap down pretty much assured a test of the Sept 12th low and when I saw TICKs spiking there, I decided to close the trade while I had the profit because a rally was likely under those conditions. As it turns out, my instincts/probabilities were correct and a rally ensued. I made 104.8% on that trade for a 4% gain on my account.
Now for the week ahead…
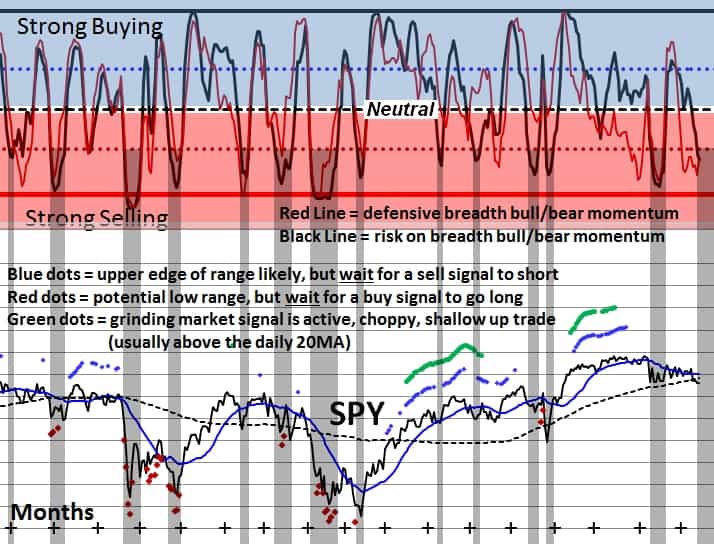
The Context Breadth – Easily the most valuable tool I’ve found in giving myself an edge was breadth. The key point though is letting breadth give you a feel for the probabilities (which means you must look at how they performed historically, i.e. how often does it trade up, flat, down in this condition?) and then letting price show you that it is in agreement.
I don’t trade when there is disagreement, usually one or the other is either catching up to the other or has left the other behind. I was pleased to see Sentimentrader commenting that current price behaviour has been very unusual in their systems. It has been a very rare occasion for their breadth signals that usually occur during downtrends to be active without price also trending down because I’ve been noticing the same in my own signals.
Some of you have likely seen this chart before, but this is my personal breadth measure of market momentum. As you can see, sometimes price is near a bottom, but more often than not, there’s more downside to come, sometimes a truckload more.

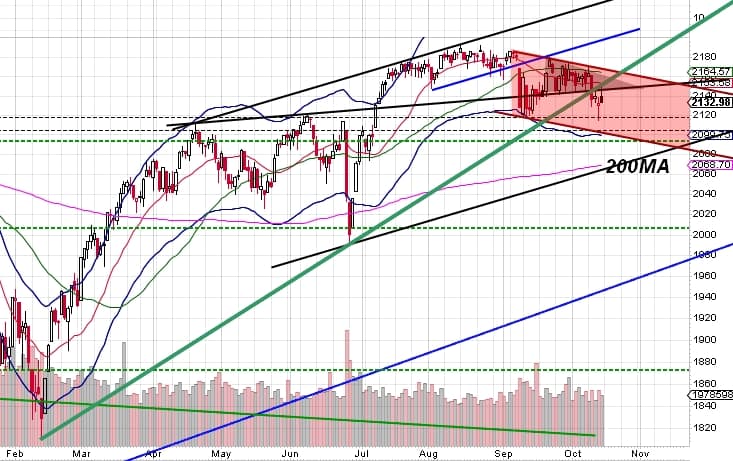
Price – From strictly a price basis, the S&P500 is making lower highs and equal lows. Yes, it’s a bullish sign to see support hold, but that’s only the first part of a bullish reversal, you also need a higher high and/or resistance being turned into support again. In addition, SPX lost its 100day MA (not shown) which is simply something to watch. More often than not, the 100MA has been slightly broken and then left behind as price rallies to new highs. That could certainly happen here so it’s good to be aware. There’s also that broken Feb-origin trendline to deal with. It was retested twice last week and failed both times. As far as price is concerned, sellers are still in control at this juncture.

The Entry/Stop: The overall market picture is still bearish in my opinion, so I’m looking for shorting opportunities. So how do I keep my risk low going into this week? Well, the way I see it, $214 has already been tested twice (desc. tri. resistance) so I pretty much want price to drop right away here. More floundering around at this level would be bullish and I would be looking for corroborating breadth signals to show that the undercurrents are supporting such a move. At the end of the day though price rules, so no matter what breadth says, if price says, GTFO of my trade, I GTFO.
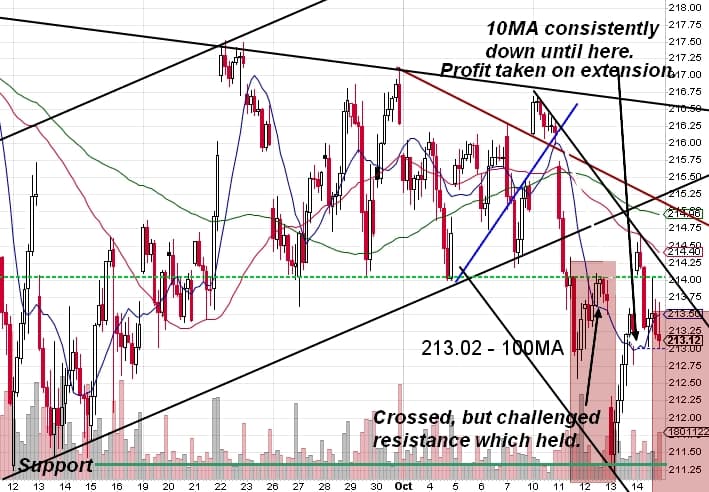
I actually got short about 2hrs prior to the close on Friday as I saw price starting to roll over. This move is only starting so there’s still room. Bear in mind, we’re right ontop of the SPY daily 100MA at 213.02 as of Friday (remember that it will change Mon morning once new price movement joins the action). The 100MA would be a fantastic short entry, imo. It was tested several times last week and it’s likely that a break below would be retested visibly on an intraday chart. Another possible short entry would be the hourly 10MA. Whatever you decide, let a CLOSING hourly bar above the moving average be the stop. I could get stopped out once or twice this way, but if the trade still looks right and I take a few entries taking small losses, it’s not a huge deal if the 3rd or 4th one makes a few hundred percent profit.
It takes time to learn to trust the process (edge), but I do now and that helps me hold on when I feel like bailing and it also helps me to cut losses quickly if price does something incongruent with my trade hypothesis.
The Profit: I generally like the 10MA on the hourly to be in agreement with the direction I’m choosing to trade. If price gets too far away from it, I start to look for taking some profits or hedging risk somehow especially after price has hit a support level of some kind. This is where context is important because if the 10MA gets crossed (which it often does) I need to know if I should close or hold.
The context tells me that I should be focusing on the bigger levels and not get too caught up in all the little wiggles and waggles price makes. I exited my position on the extended move from the 10MA that hit $211.25 support, sidestepped the rally and got short again after price got above the 10MA, failed at resistance and THEN began to roll over again, not before. This way, I kept profits that were still in hand and waited for price to give me a better risk:reward opportunity.
So the big picture suggests that the first target I’m looking for is $210 at the channel low. I would for sure take at least half off there and reevaluate. It’s highly likely price gets some kind of bounce there.
If price manages to get below that red channel, the channel low would very likely be retested from the underside before continuing down (could be very quick). If one still had a half position open, they could add a second position there or just let the remainder of the position run and cover at the 200MA. Overthrows are common on channels and are great exit points.
Good luck this week, Slopers.

