
I’m concluding latin post title week with a phrase which means ‘before all else, be armed’. This market could get very interesting over the next few weeks, hard as that might be to imagine after the last few weeks. We must all be careful not to get caught on the wrong side of a trade that goes the other way hard. The mini-crash almost exactly a year ago followed an August daily band compression that was smaller than this one.
Decent market information is a useful weapon too of course, Stan and I are analysts rather than clairvoyants but on a good day it can be hard to tell one from the other. I’m particularly pleased with this video that I recorded last night for our Daily Video Service subscribers at theartofchart.net, which has given me a very nice morning and a great start to the holiday weekend. I’ll go through the calls on the companion bonus charts below, which were used in the video and then posted for subscribers afterwards. I’ve not included the ES and TF charts as I was mainly relying on the NQ chart for equity index direction, for reasons that should be obvious on the video and chart:
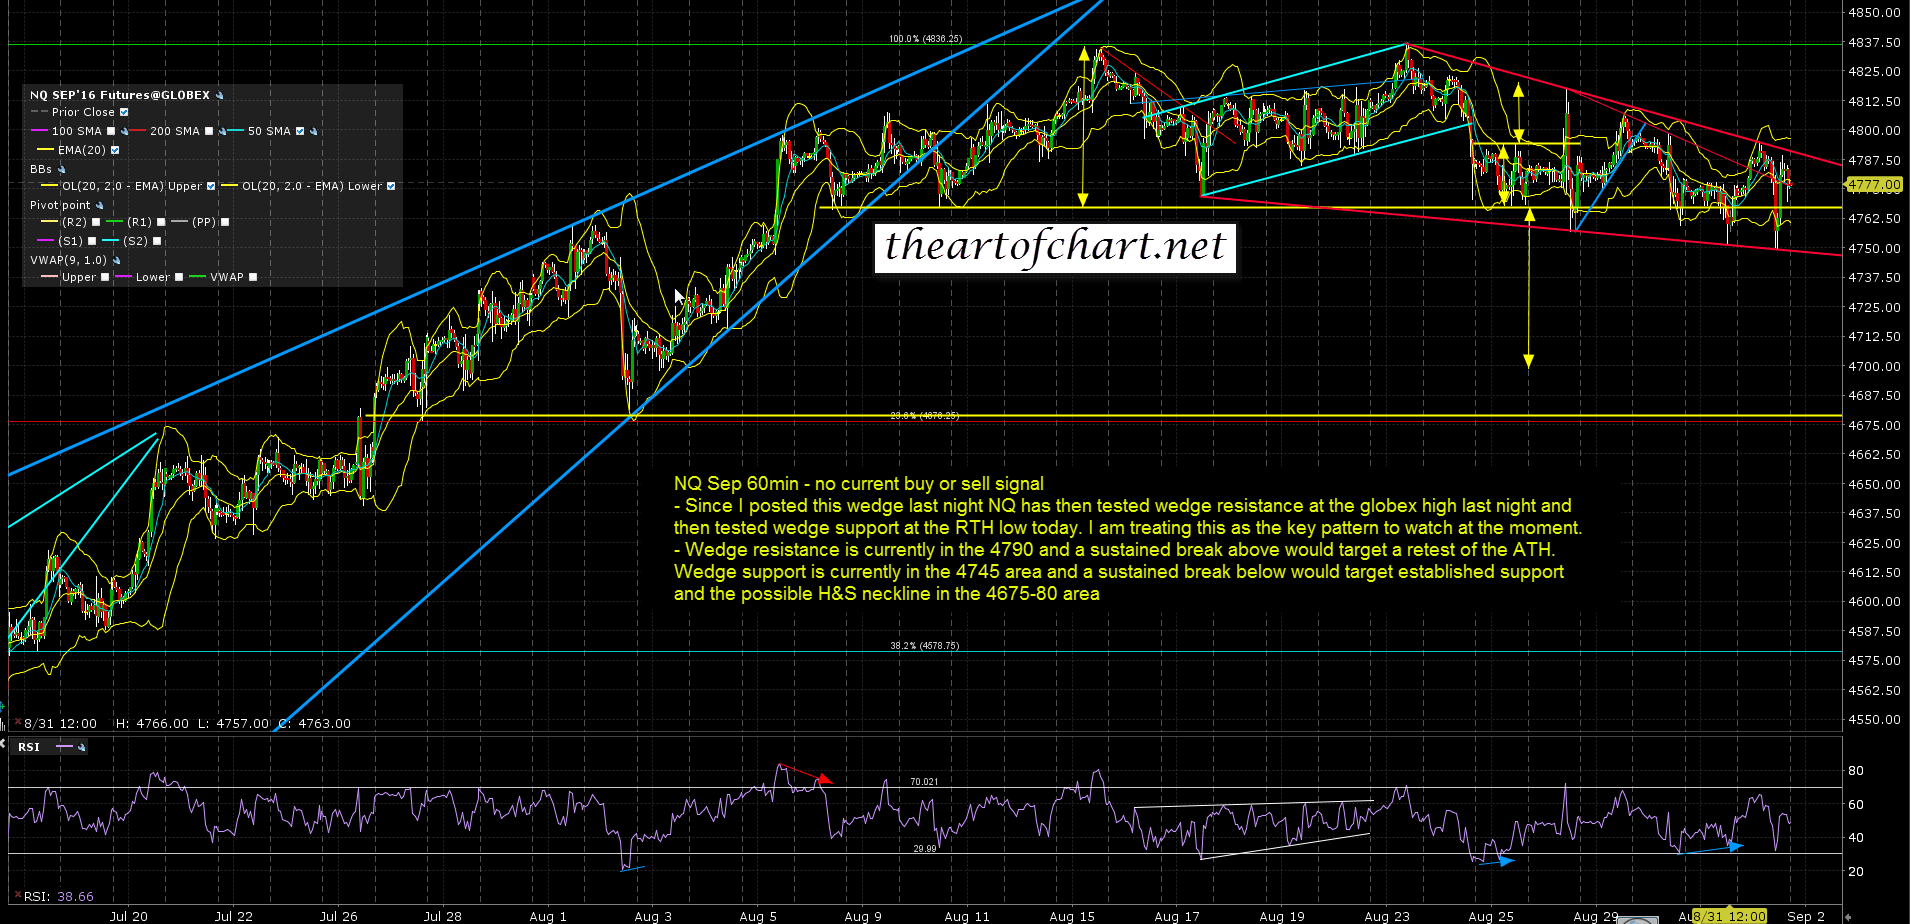
This falling wedge on NQ that I posted on Wednesday night captured the Wednesday night high, yesterday’s low, and then the globex high pre-NFP. The wedge broke up on the NFP numbers and with the low window ending that likely wraps it up for this all too modest retracement. The obvious next target on NQ is a retest of the all time high, and we should be back on buy the dip until that is tested. With the next high window in about three weeks we could well see a conviction break of the all time high. I’m considering possible trendline resistance options if that is the case. NQ Sep 60min chart:
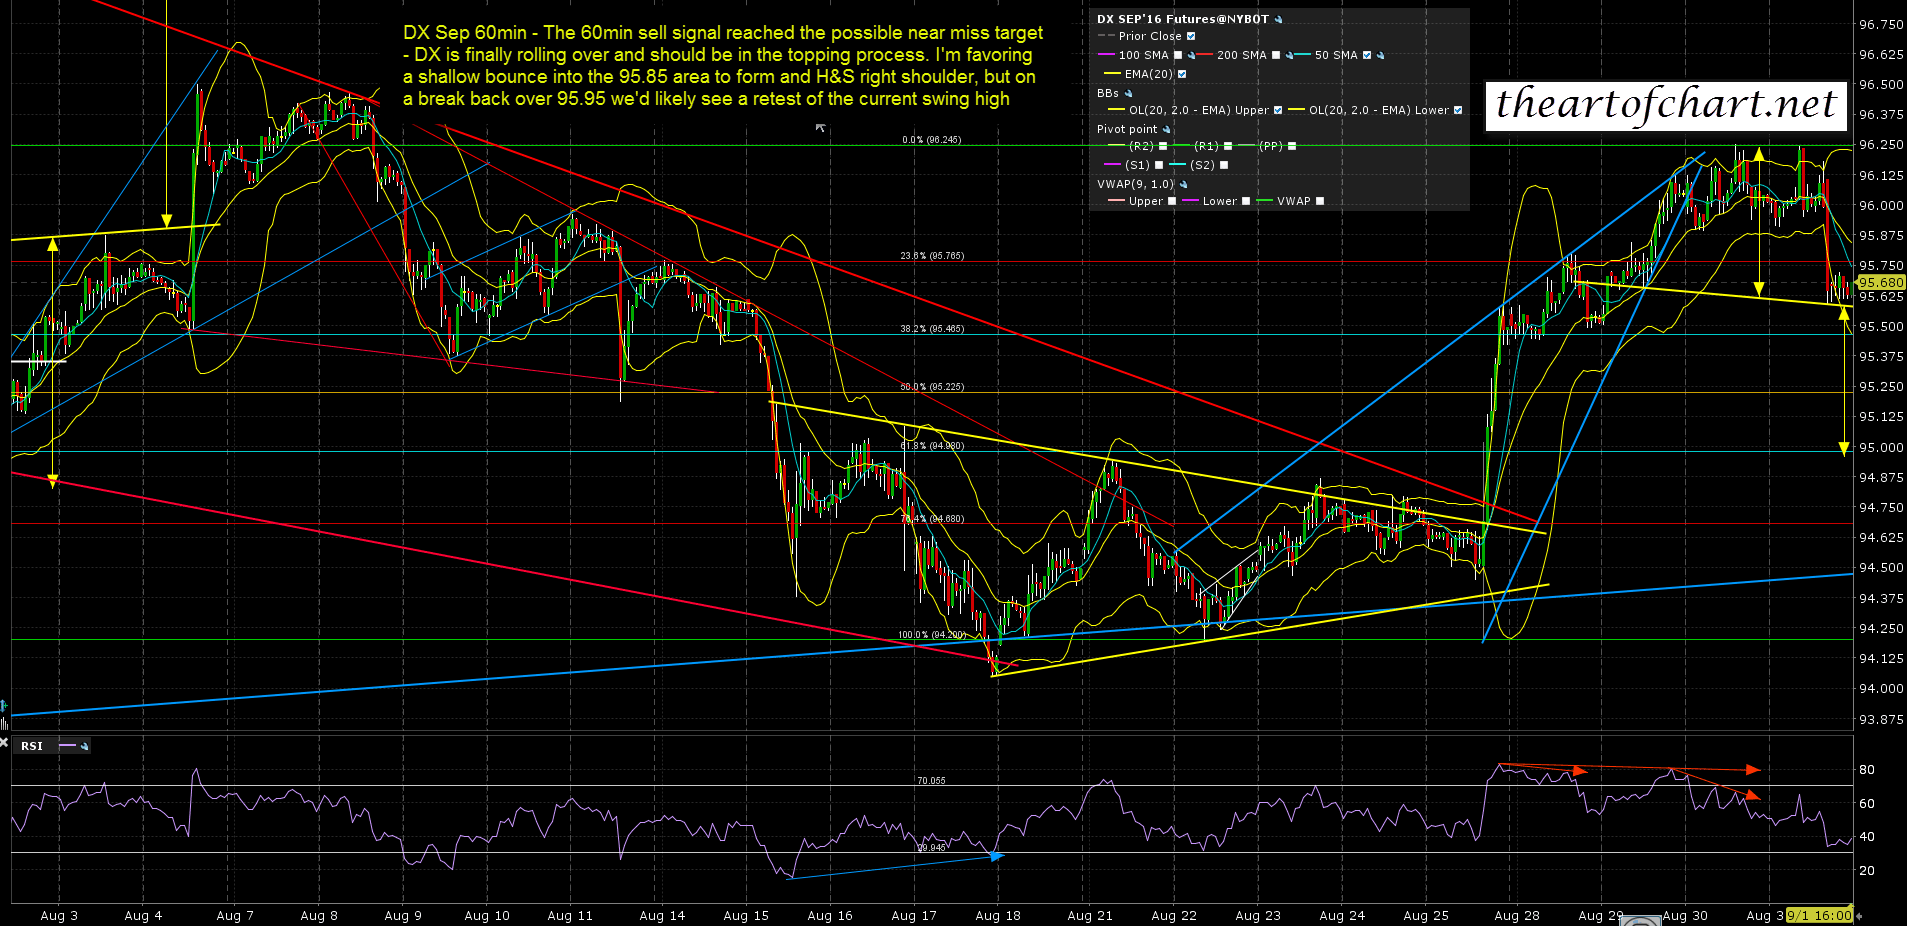
On DX I was looking for a modest rally to make an H&S high shoulder. That delivered and reversed in the ideal target area, and the H&S then broke down on NFP. The H&S didn’t make target however, reversing in the 50% fib retracement area and DX may need a retest of this high to make a likely second high of a double top. DX Sep 60min chart:
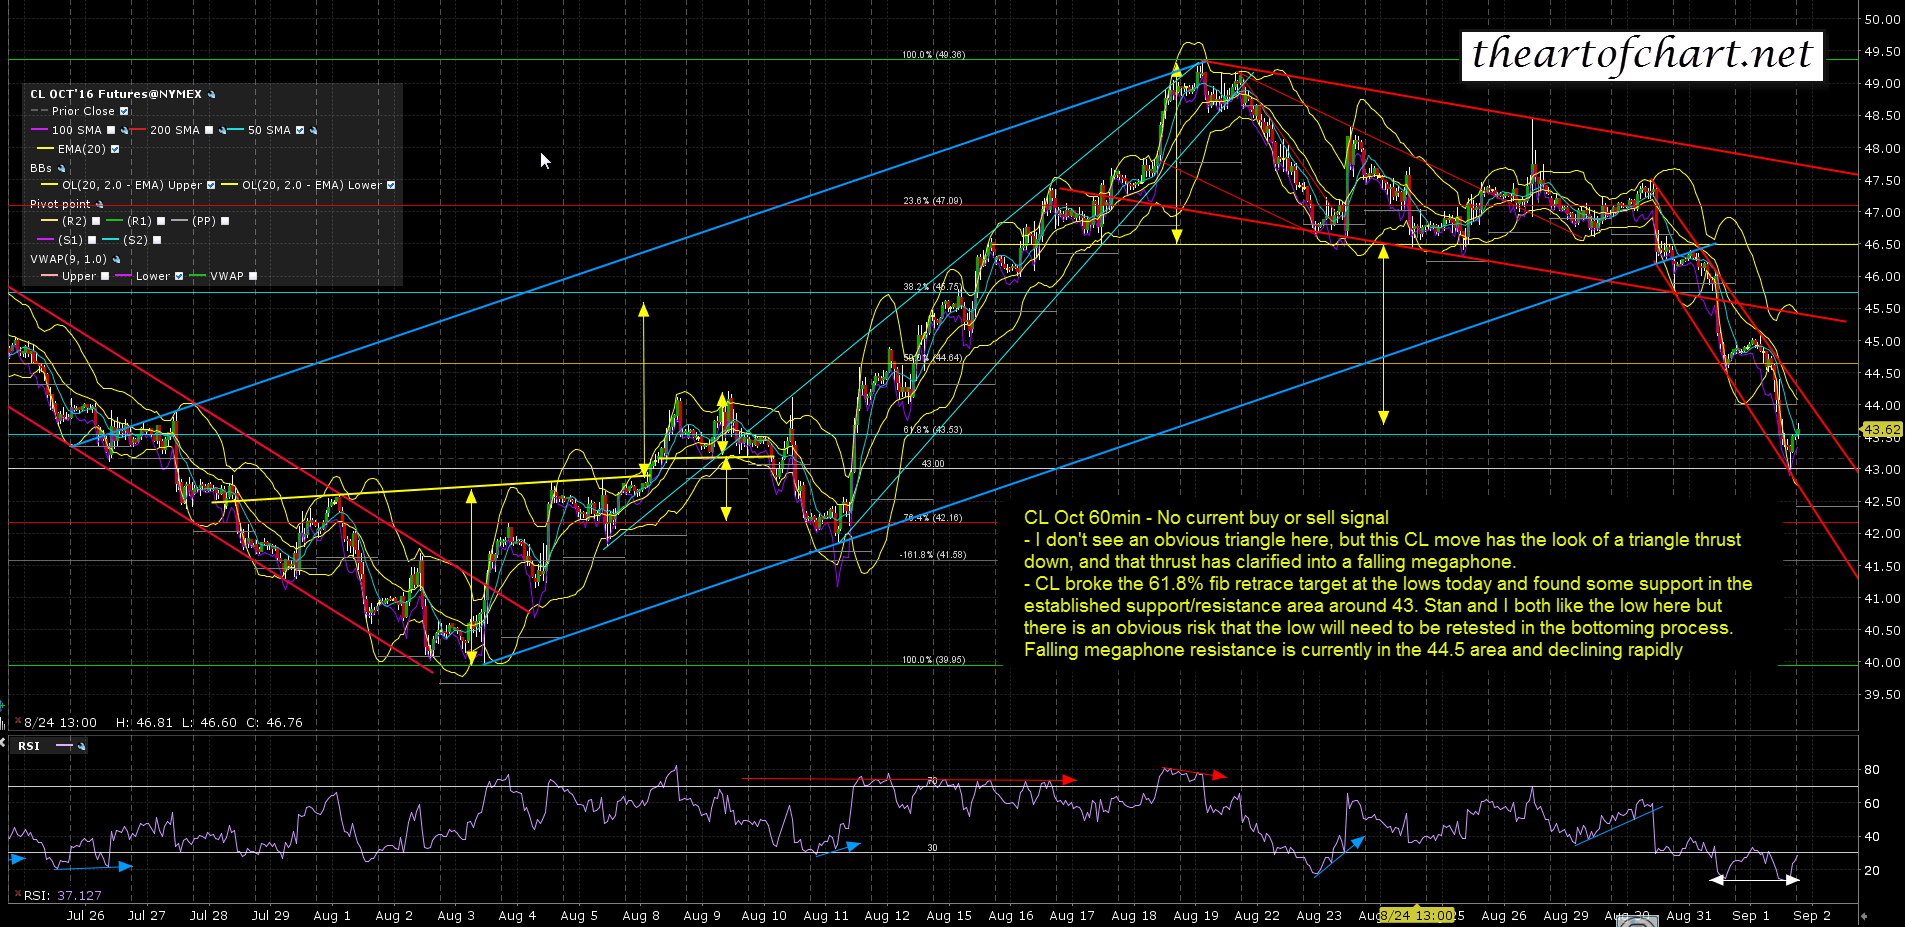
CL broke up from the falling megaphone overnight and has made the first decent resistance area at 44.5. 43 looks good as a retracement low but might need a retest. CL Oct 60min chart:
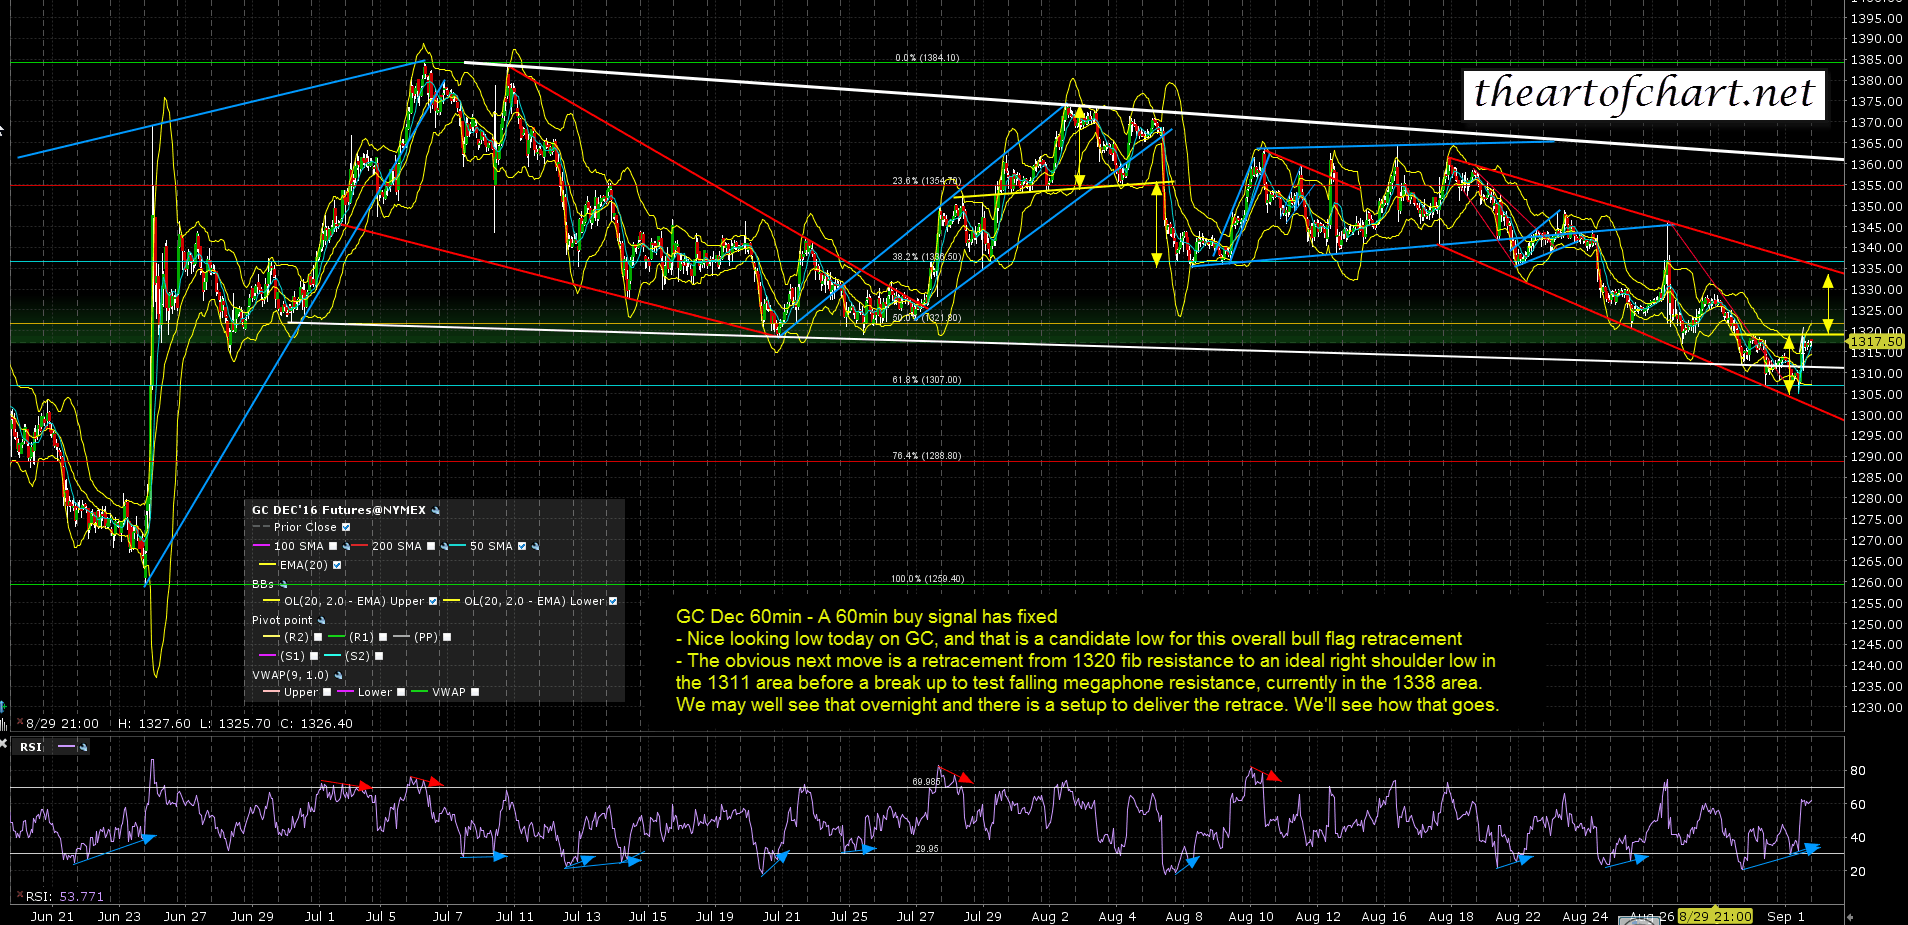
GC has been a very good performer this week. The low was where we expected. I called the bottoming setup within a minute or two of the low yesterday morning on the subscriber only twitter feed, and while the right shoulder retracement overnight didn’t make the ideal right shoulder low, the IHS completed forming, broke up, made target and GC tested falling megaphone resistance at NFP this morning. So far that falling megaphone resistance is holding. GC Dec 60min chart:
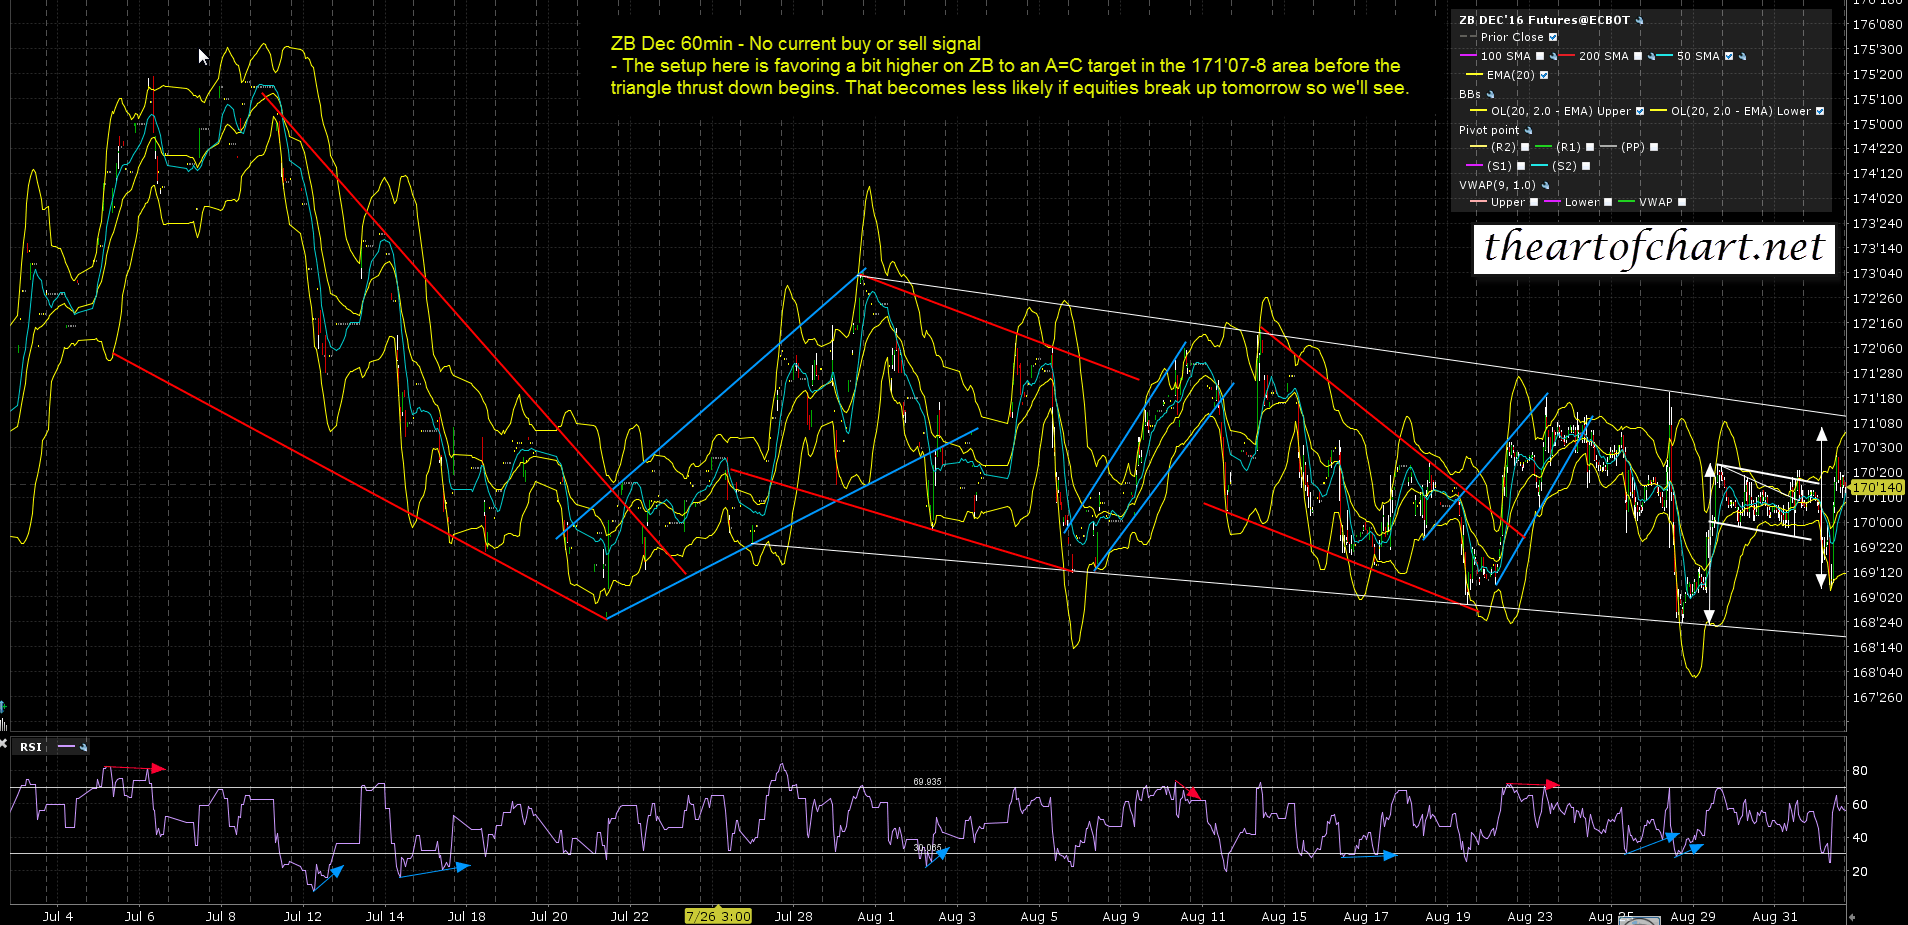
ZB was the top performer of the morning, rising a buck making my upside A=C target to the tick before rejecting over two bucks to start the next leg down. Expecting more downside & I show the TNX chart on the video with (an inverted) forecast of what we’re looking for on bond prices over the next few weeks ideally, though that is a price forecast only, rather than both price and time. ZB Dec 60min chart:
NG was another nice performer, making my ideal target area overnight as discussed in the video and then breaking up. We are looking for a potentially huge move up to start on NG here. We’ll see how that goes. NG Oct 60min chart:

How accurate can technical analysis be forecasting future moves? Pretty good, with the obvious caveat that there is no such thing as a sure thing, and that a high probability setup can always fail into a low probability outcome. Stan and I reckon that we do 70% or better on forecasts and are happy with that. If that level of certainty in a forecast is too low, then you really need a priest rather than an analyst, as a priest can forecast your prospects with close to 100% certainty, albeit with an accuracy that can be harder to measure.
Stan and I are doing our monthly public Chart Chat on Sunday and we’ll be running through the usual 30+ instruments there and taking questions. If you have any interest in good TA, or the prospects for the major tradeable asset prices over multiple timeframes, then you can sign up for that here. Everyone have a great holiday weekend 🙂
