SPX didn’t retest the retracement low on Tuesday and that blew the best chance to do that in the next few days. The stats for today through Tuesday lean modestly bullish, and fairly strongly bullish on Wednesday and Thursday. This doesn’t mean that SPX has to close higher on all or indeed any of those days, but it does mean that the bulls have the wind at their backs on those days rather than trying to advance against it. The next day with a significantly bearish lean is July opex on Friday 15th July.
In the short term SPX gapped over the daily middle band yesterday and that was the first serious short term resistance. If we are to see a retest of the retracement low in the next few days, which is still possible, then the clearest indication for that would be a daily rejection candle today that rolled back yesterday’s candle entirely and delivered a clear close back below the daily middle band, which closed yesterday at 3630.
What could deliver that today? Maybe a bad NFP number, but it isn’t the kind of move we would typically see on a Friday and a rejection like this would usually be on the day after the break up. If we don’t see that rejection today then my working assumption will be that the daily middle band has been converted into support for the time being.
SPX daily BBs chart:
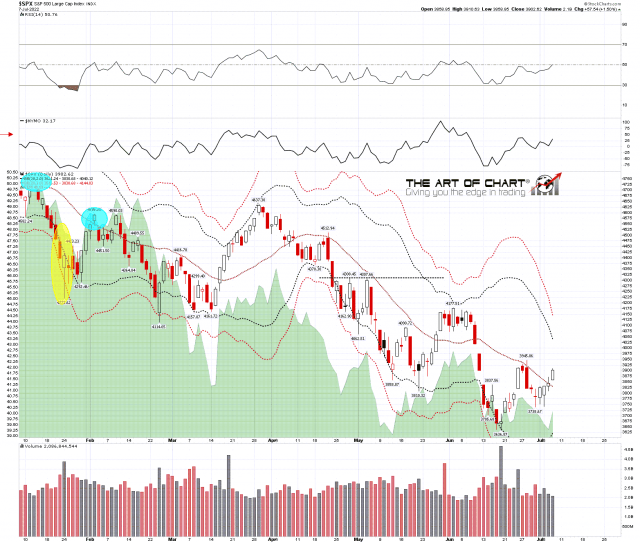
If the daily middle band does convert into support, then the next obvious target would be the weekly middle band, which has been the main downtrend resistance this year. That would be an obvious fail area into a possible low retest of course, but if that was to break and be converted into support, there would be a possible run into the retest of the all time highs that all the bull flag setups on the US equity indices are suggesting may be coming.
SPX weekly chart:
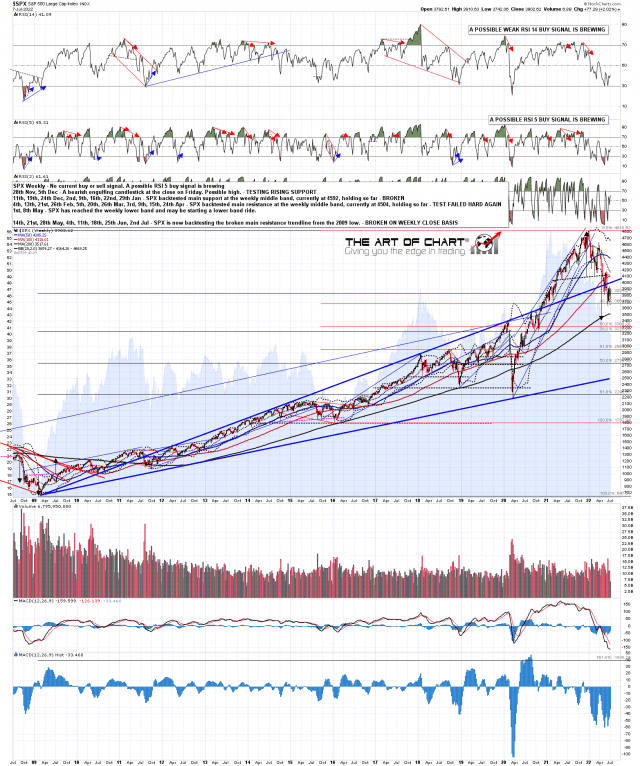
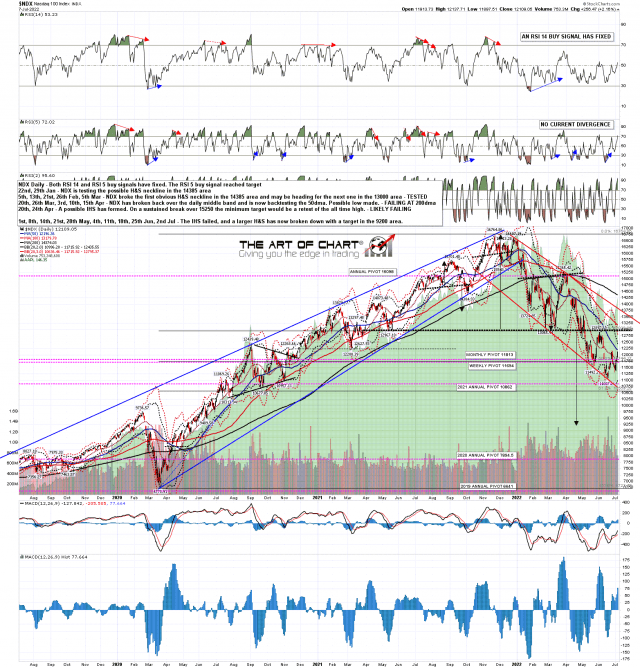
NDX has led the way down this year but looks the most potentially bullish of the US indices now. There is positive divergence on all of them but only NDX already has a weekly RSI buy signal fixed. It has also already retraced 50% of the move up from the 2020 low and has a very decent quality bull flag formed on the daily chart below.
NDX daily chart:
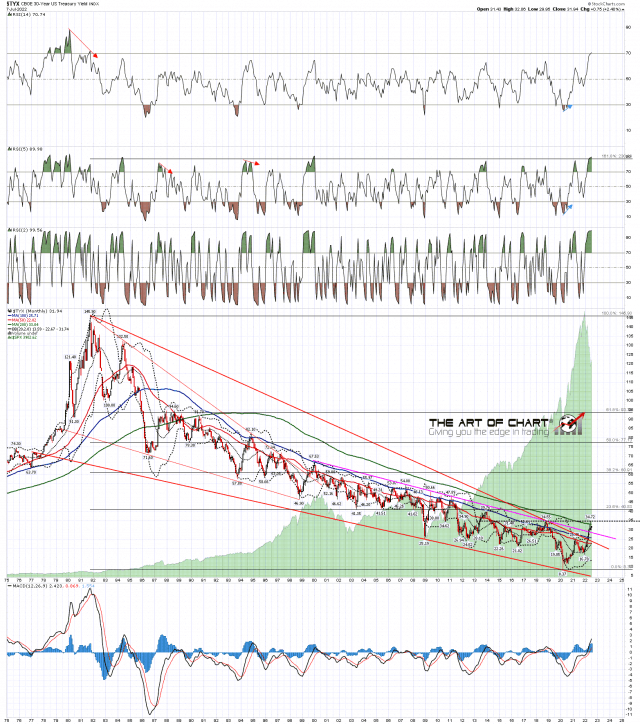
That high retest isn’t the only odd looking move been suggested by the charts here. When I was talking late last year about the the IHS almost formed on TNX that might deliver a doubling of the 10yr treasury yield from 1.6% to 3.2% I mentioned that the obvious next move after making that target (made a few weeks ago) would be a strong rally on bonds that might last several months. Here’s how that looks on the TYX monthly chart where you can see that the move up this year has almost perfectly reached a possible IHS neckline, and that bonds rally could deliver a right shoulder to complete that pattern to then take bonds a lot lower lower and yields a lot higher.
I’ve been wondering how that could be possible in this inflationary and economic background and the markets over recent weeks may be giving us an answer as to how both that equities high retest and strong bond rally might be achieved here.
TYX monthly chart:
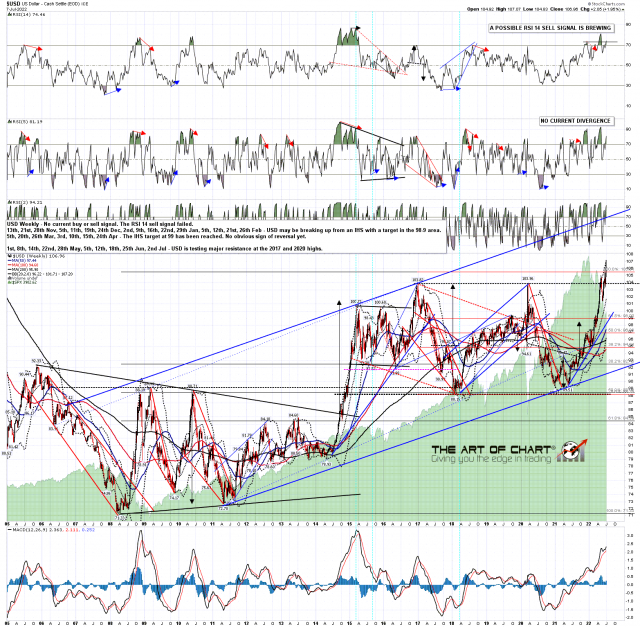
A few weeks ago I was looking at USD and was expecting to see USD top out and fail hard in the 104-5 area, but was noting that USD is in a perfect longer term rising channel and that if USD was to break over 104/5 and convert that to support, then the next obvious target would be channel resistance in the 112 to 112.5 area.
USD has now broken up and may be on the way to 112, though in the short term there may well be a retracement and another backtest of that broken resistance. As USD has been breaking up there have been strong declines on most commodities, and if USD continues higher then they may well go lower.
If this is sustained then the headline inflation numbers may well drop sharply and that decline may well be sustained for several months. That could open a time window to deliver these moves on both equities and bonds before commodities and inflation most likely start rising again and likely deliver further declines on both equity and bond markets.
Just a theory at this stage, but that may be the way this goes, and in the absence of that it is a little hard to see how we could see all time high retests on equities and a strong multi-month rally on bonds as the charts are suggesting but as ever, might not otherwise might that leap from potential to actuality.
USD weekly chart:
We are doing our monthly free public Chart Chat on Sunday at 4pm Eastern Time and that should be pretty interesting. All are welcome and if you’d like to attend you can register for that here or on our July Free Webinars page.
Everyone have a great weekend 🙂


