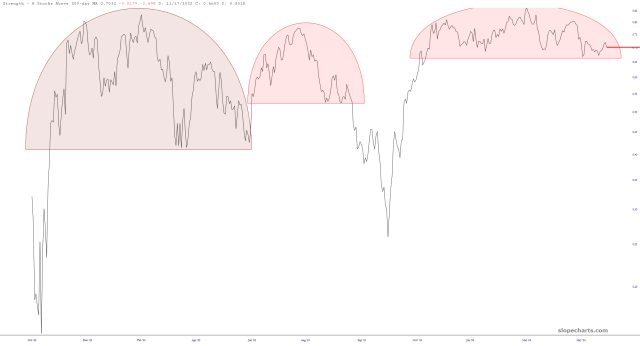
Creeeeeeeeeeek! The percentage of stocks above their 200-day moving average is steadily declining, and what might be a powerful topping pattern in this indicator is getting close to completion.
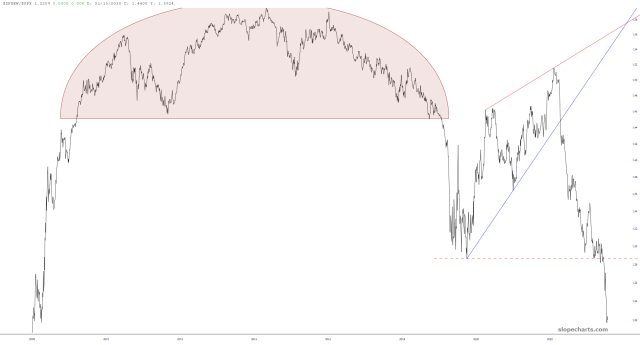
This same idea is playing out with the ratio chart of the S&P (equal weight) and S&P (normal weighting). Simply stated, a tiny handful of stocks are doing all the heavy lifting, but the market overall is getting sick.