
Good morning, everyone, and welcome to a new trading week.
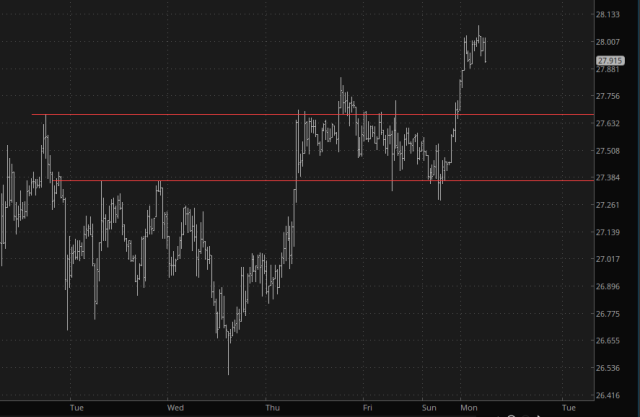
Pre-market, it’s pretty much green across the board, with precious metals finally showing some signs of life. Silver was looking pretty weak during Sunday’s trading, but out of the blue it began to rally, and as of this composition it’s up about 1.2%. Of course, metals could simply be aping the behavior of equities, but my thesis is that precious metals will eventually break free and continue higher while equities sink.
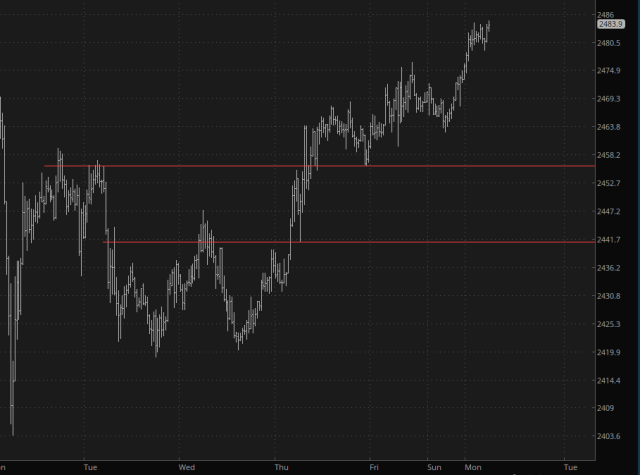
Gold is up as well, although less than half as much on a percentage basis. It’s clear that the panic selling one week ago was a great entry for gold, which was briefly smashed down to about $2400.
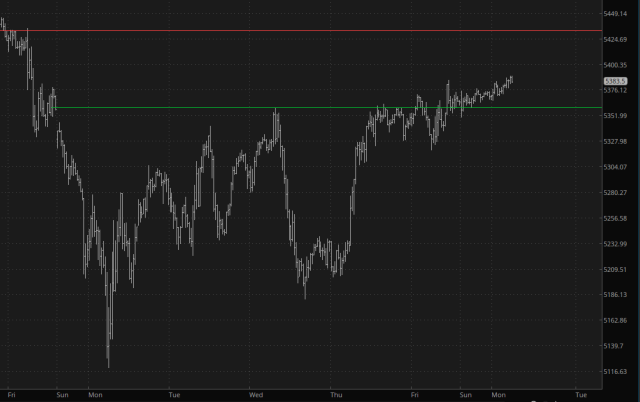
As for U.S. equities, they continue to slowly drift higher, continuing the behavior from late Thursday and all-day Friday. The next major resistance on the /ES is 5432 (red line), although I’m not sure we’ll get that far before things start to crack again.
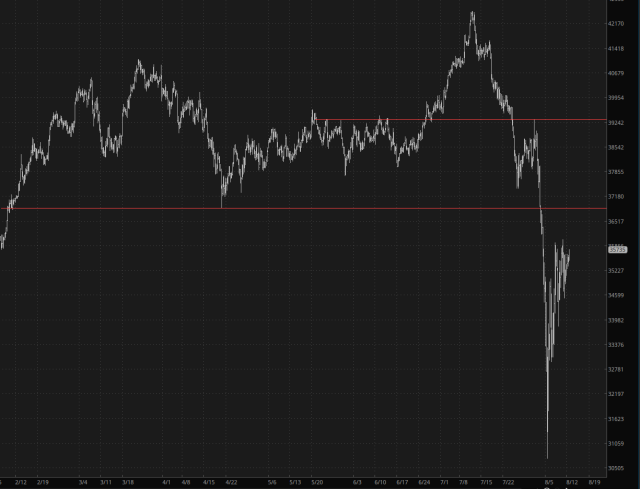
For U.S. stocks, however, there’s one chart that’s vastly more important than any of these, and it’s from the other side of the Pacific Ocean: the /NKD (Nikkei 225 futures).
The chart is signaling, plain as day, that tremendous resistance is imminent (again, the red line) and that gargantuan mass of overhead supply is going to stop it in its tracks. Briefly stated, the /NKD is the best friend of the bears, although hardly any of them realize it.
For myself, I remain long gold and silver and short equities (13 positions) with 20% cash waiting in the wings for new entries. Importantly, I have stressed to myself that the gold/silver positions are deliberately long term, and I’ve got to exercise vastly more patience with them than I do any shorts, the latter of which I will dispatch with impunity if they don’t behave themselves in accordance with the charts.
Let’s go get ’em!
