
I was looking at this rising wedge on SPX posted on twitter earlier this week by someone with the comment that the break above this week is a bearish overthrow that would likely precede a break down from the wedge and then a likely 38.2% to 61.8% retracement of the wedge. Obviously I’ve been posting that wedge and looking at it every day in my premarket videos for weeks, and it is a very decent quality pattern, but I’m doubtful.
If we were going to see that retracement happen, then the obvious time to do that would have been over the last four weeks or so, in the obvious bearish window into late October. That didn’t happen, so unless we see some evidence that the bears are still in the game, I’m going to remain doubtful.
That said, if we do see some retracement from here, I would note that there is currently a possible small double top setup here that on a sustained break below 5804.48 would look for a target in the 5730-7 area. If that was to deliver then rising wedge support, currently in the 5700 area, would be in range.
Could we see that happen? Sure. Will we see that happen? Well I won’t be holding my breath waiting.
SPX 15min chart:
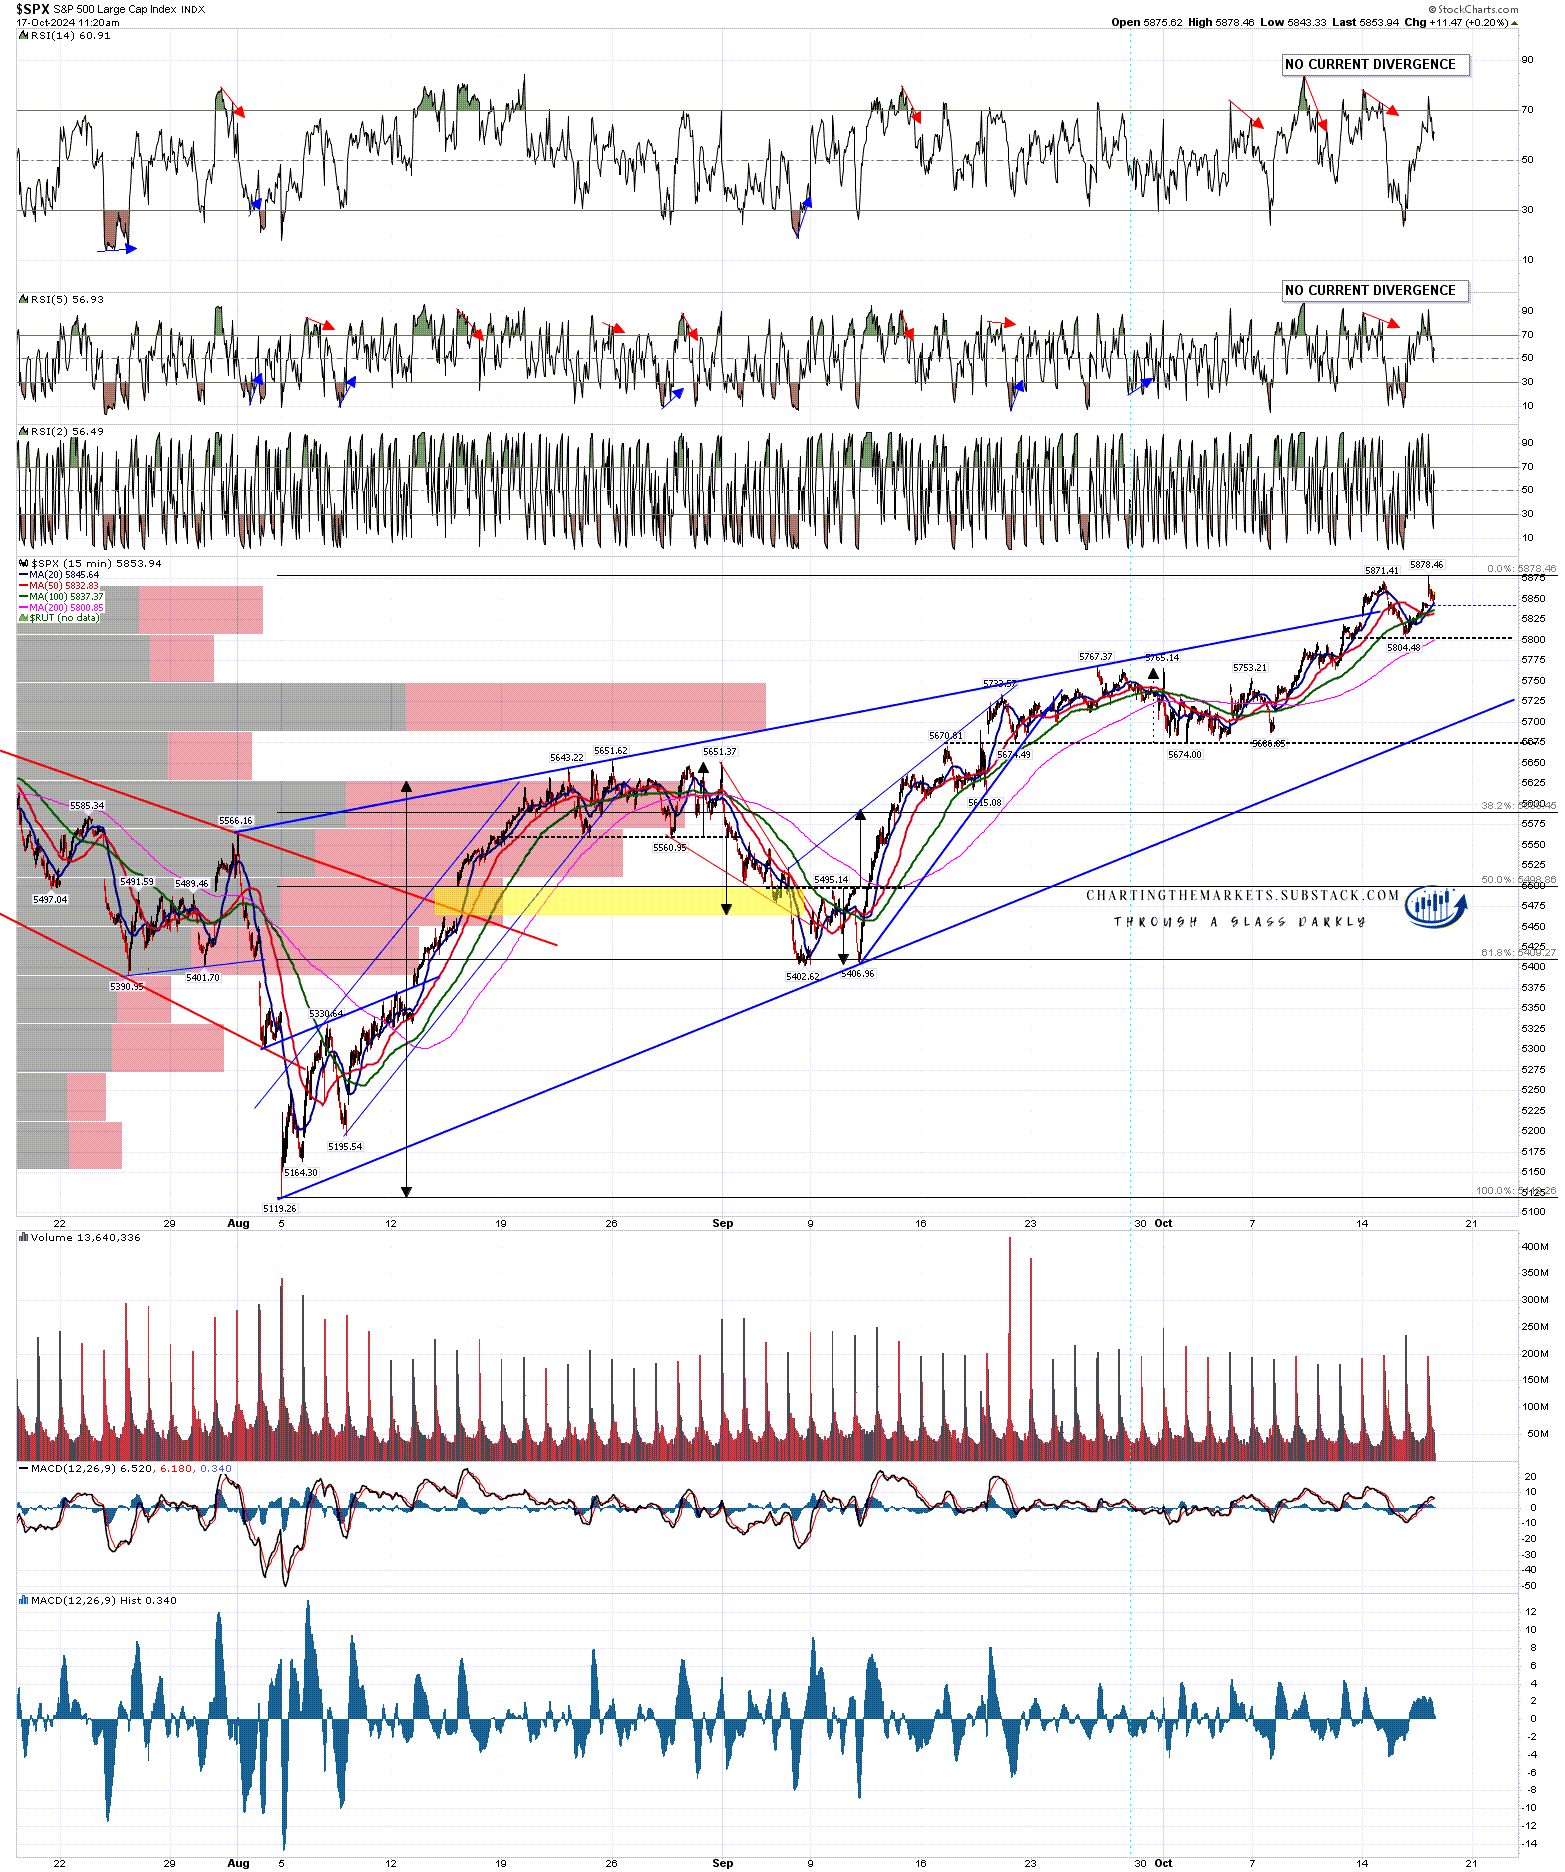
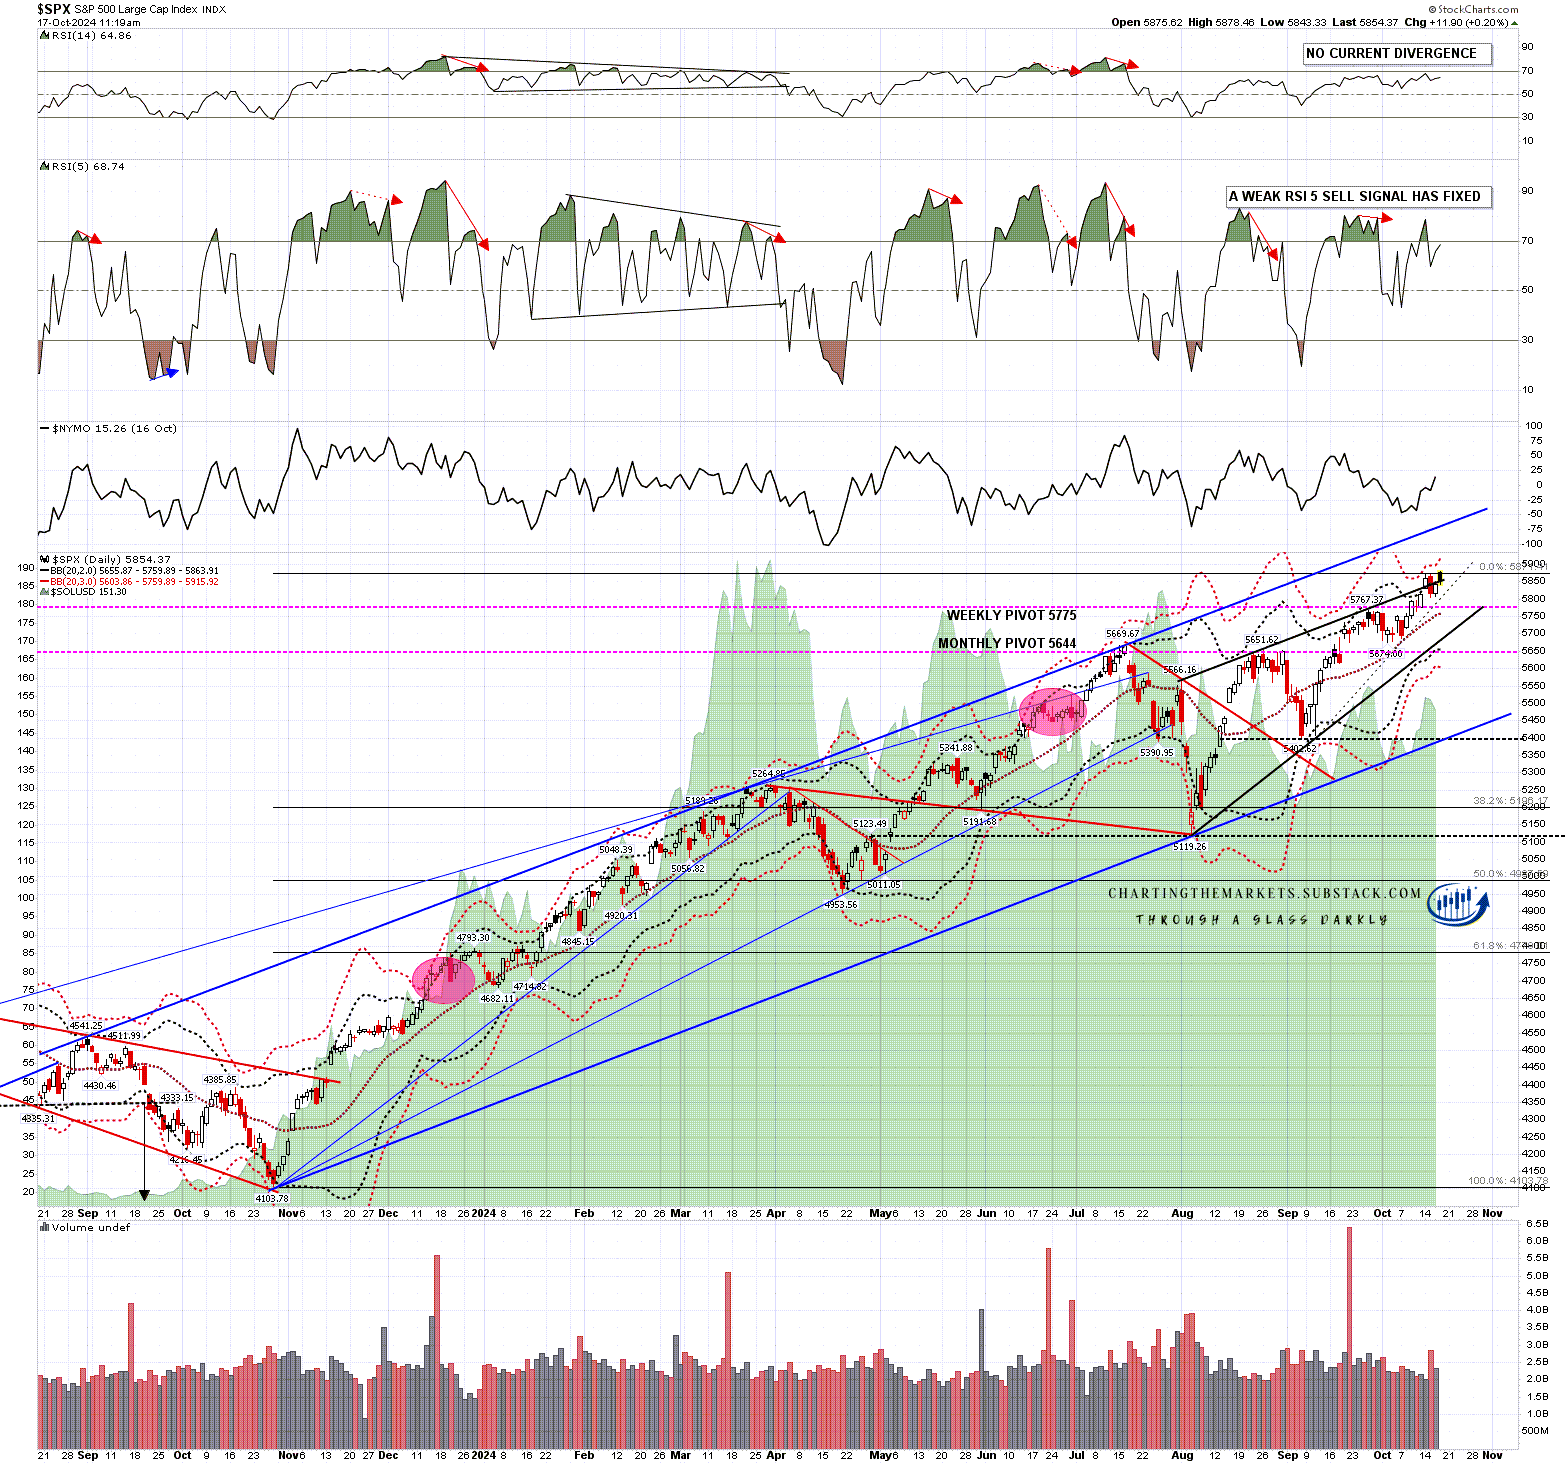
If we are going to see that happen then the first step on the way would be a break and conversion of the daily middle band, currently at 5760, to resistance. I would note that there is still a fixed weak RSI 5 sell signal here, and that if there wasn’t, a possible full RSI 5 sell signal would be brewing.
If SPX breaks higher here then the obvious next target is the resistance trendline above, currently in the 6125 area, and rising of course.
SPX daily BBs chart:
There is also a possible short term double top setup here on Dow, and a sustained break back below 42.7k would look for a target in the 42.1k area. Decent looking support in the 41.8k area, then rising wedge support currently in the 41,500 area.
The rising wedge is also high quality, like the one on SPX, and there is still a fixed daily RSI 5 sell signal on Dow as well. Could be. We’ll see.
INDU 15min chart:
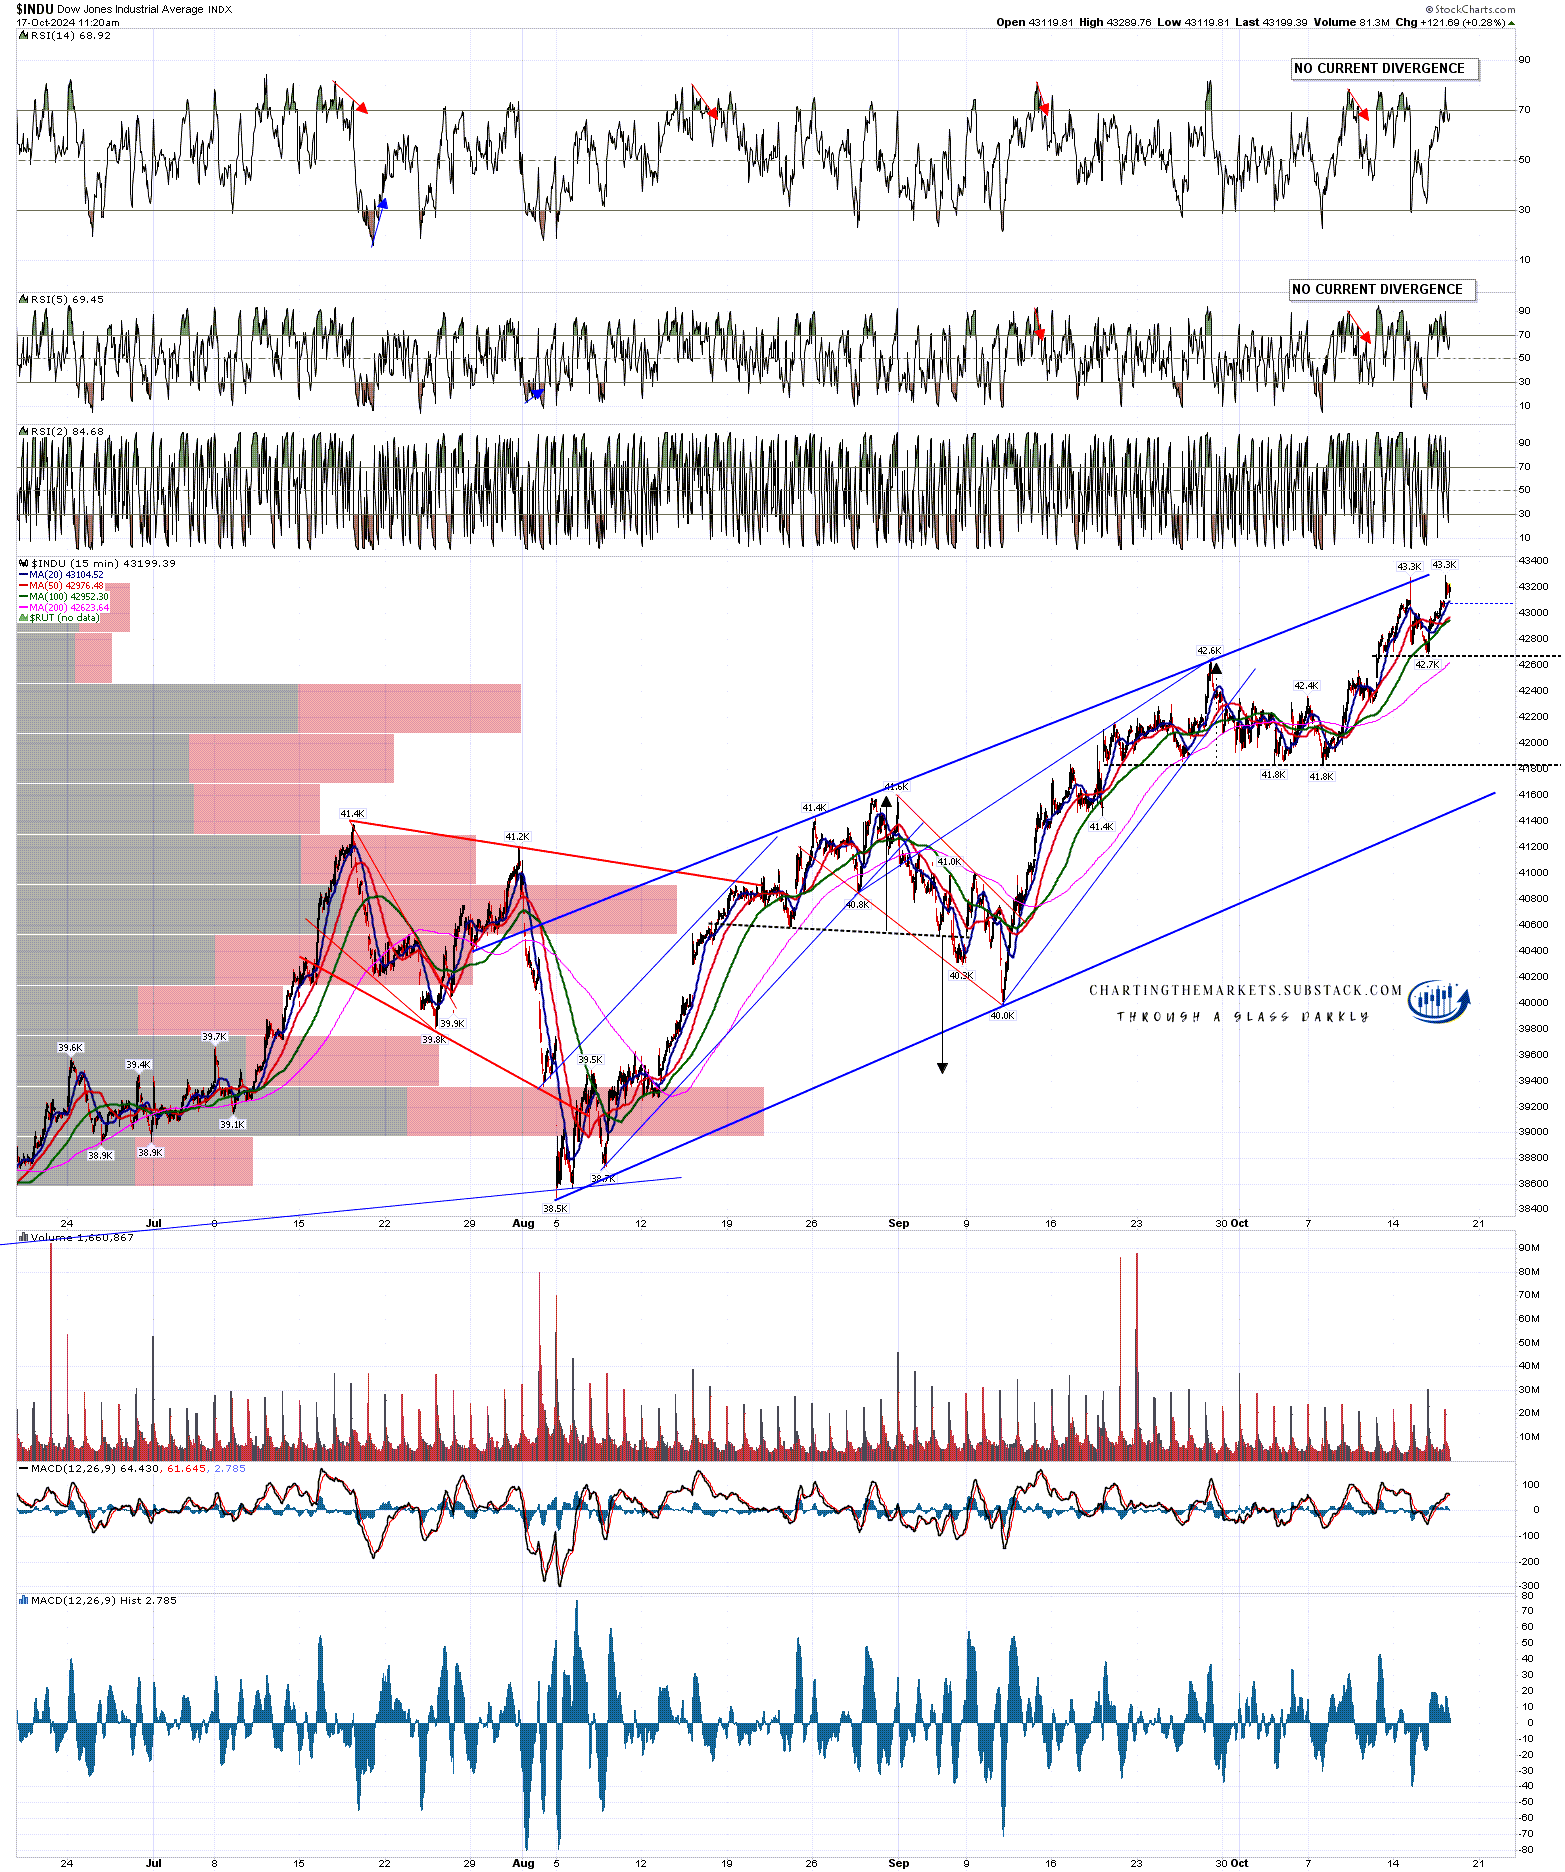
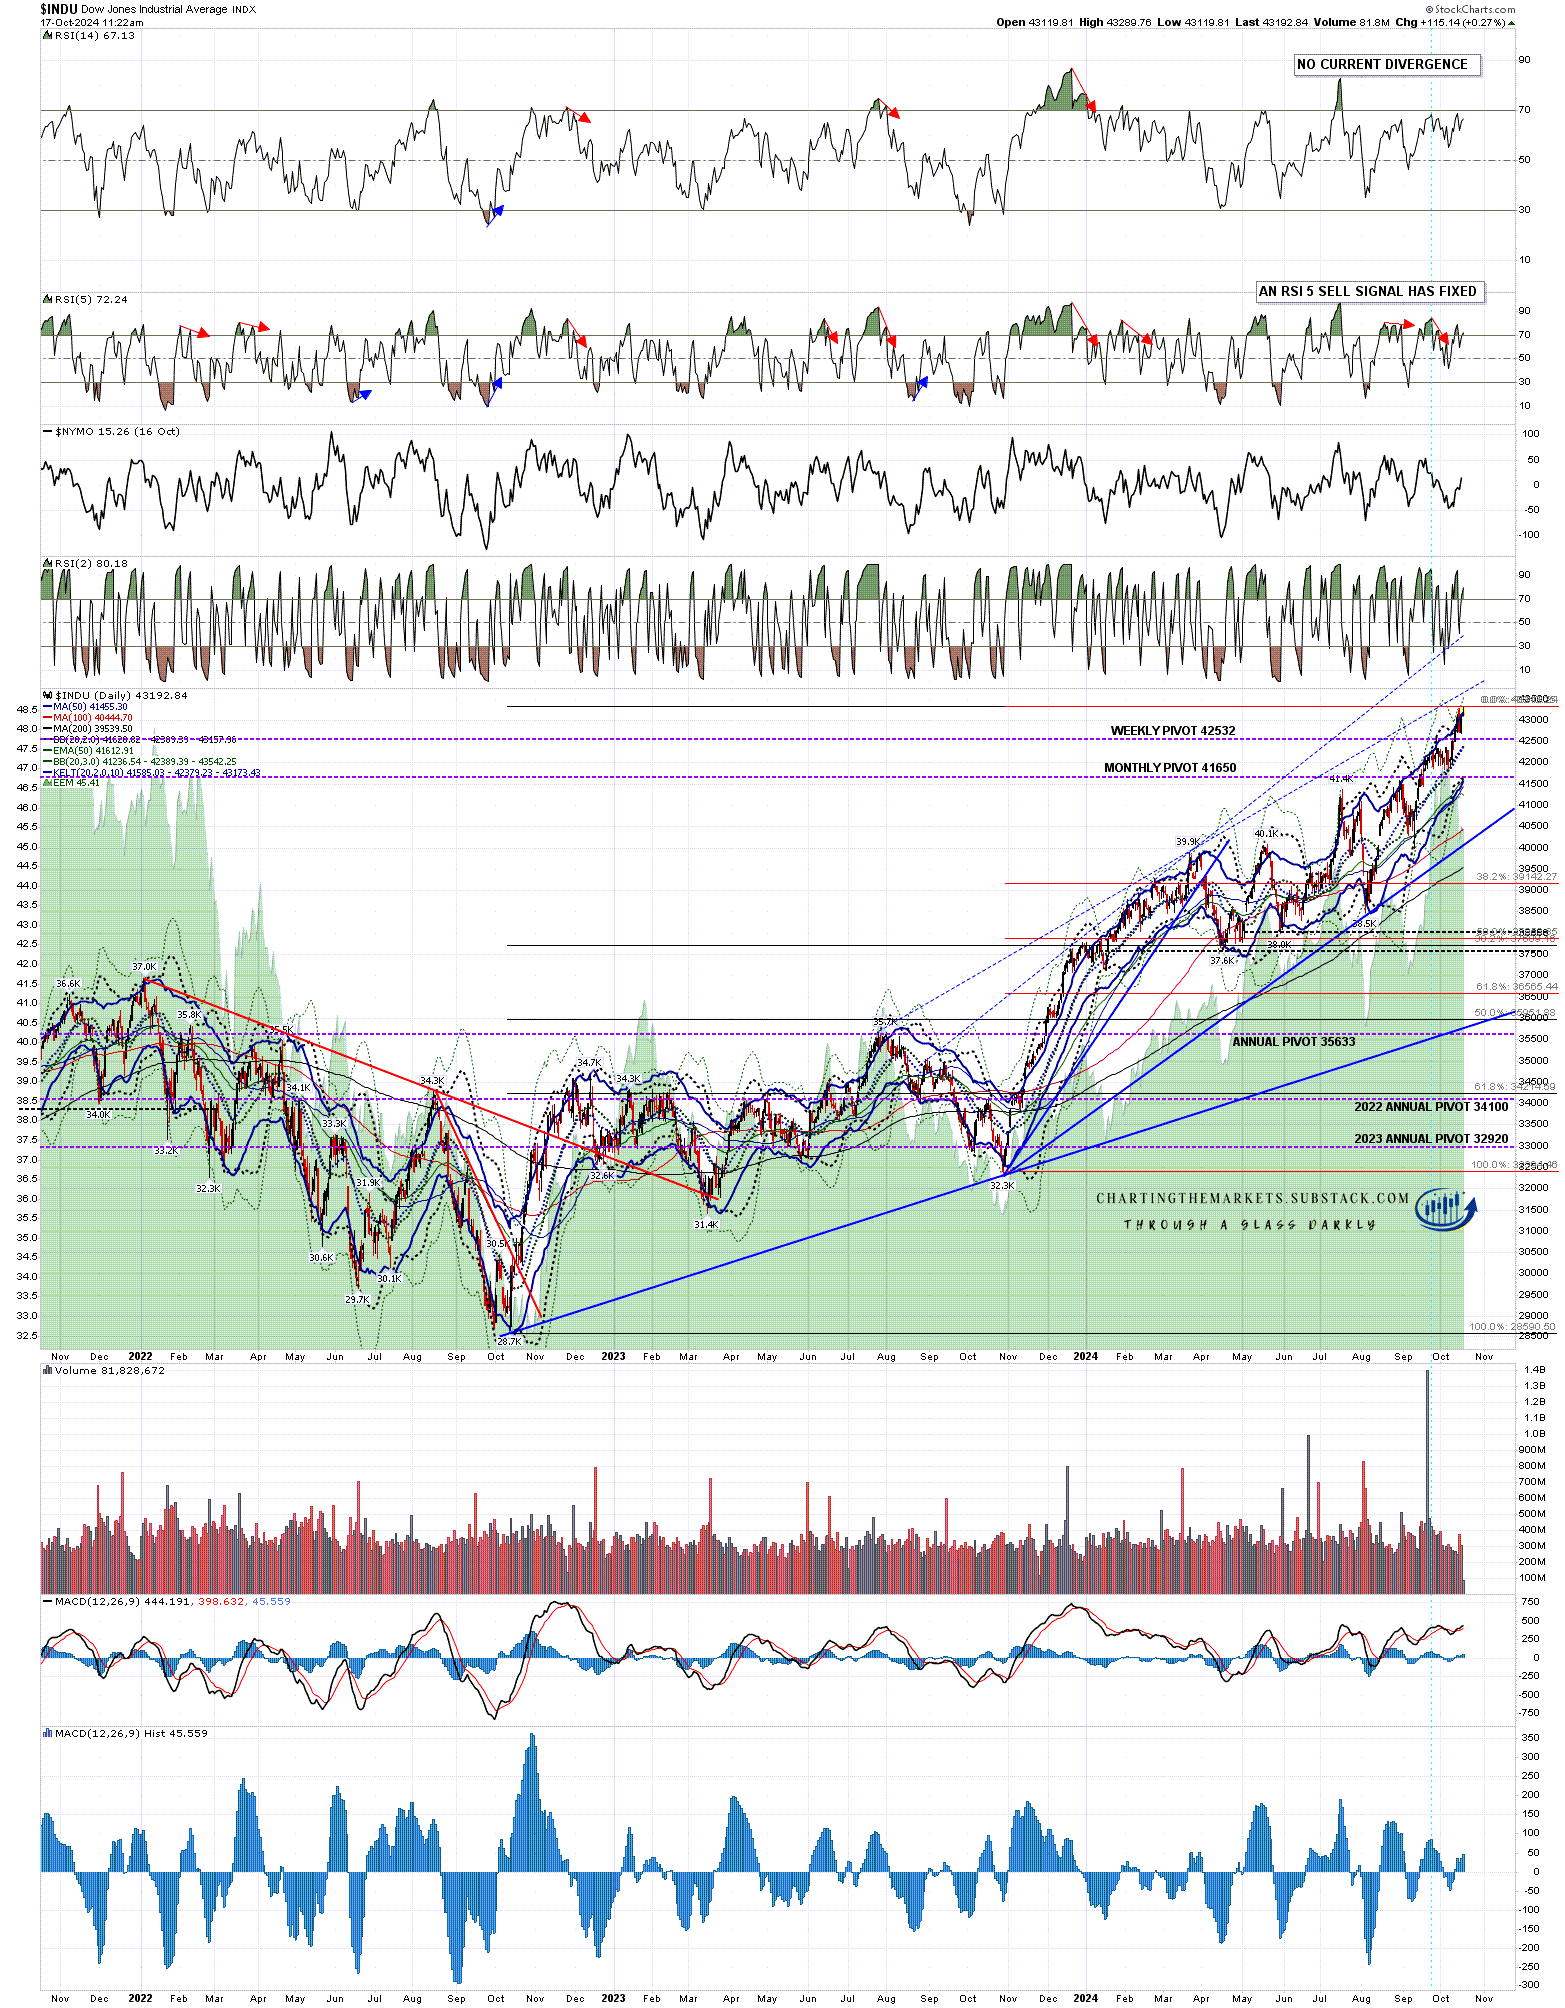
As I mentioned there is still a fixed RSI 5 sell signal on Dow, and as with SPX, if there wasn’t already a sell signal fixed here, another would be brewing.
On the bigger picture I have no clear target above in the event of a break up. I’ve drawn in a couple of options, of which the higher trendline is better quality, but we might just need to wait for the next high.
INDU daily BBs chart:
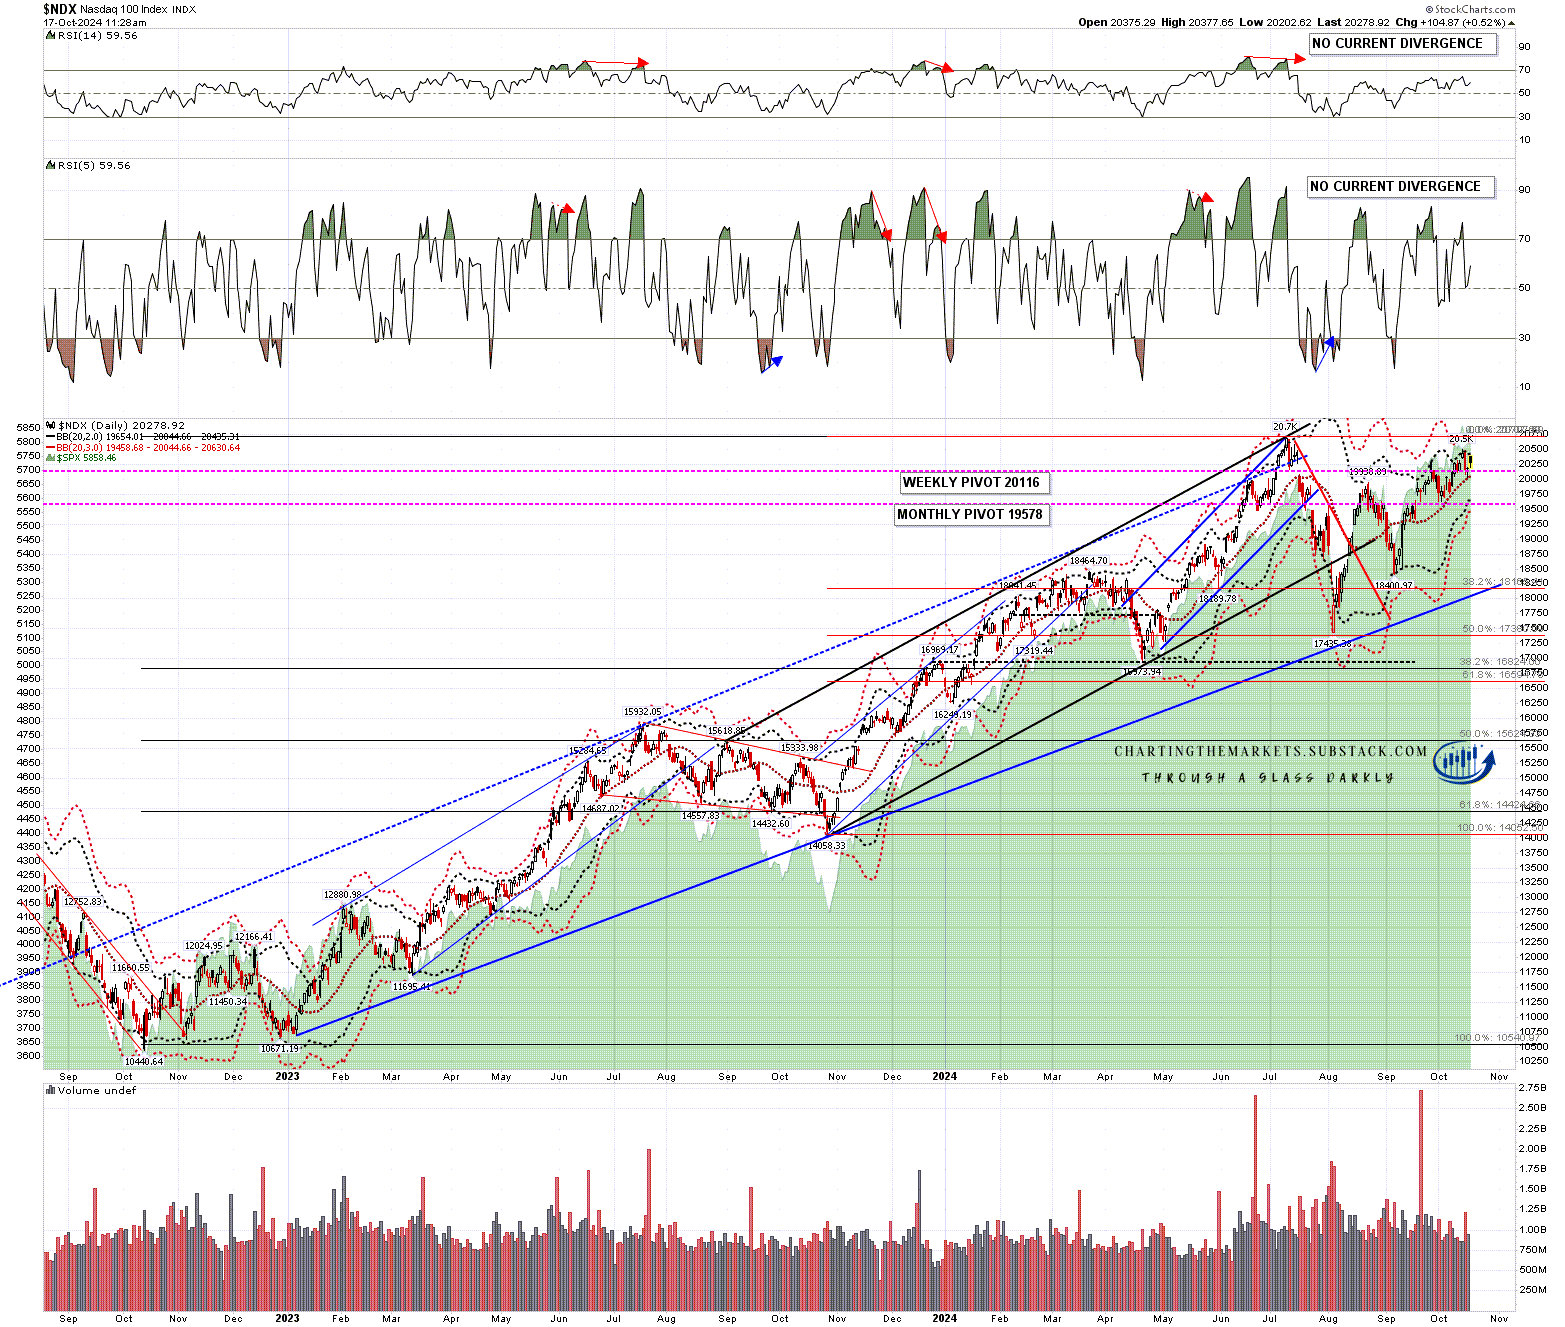
Any sign of a turn on NDX? Well we haven’t been seeing new highs there, and there’s no short term double top. There’s a short term rising wedge there too, with wedge support currently in the 19,500 area. We’ll see.
On the bigger picture NDX backtested the daily middle band, currently at 20,044, earlier this week and it held perfectly. If that tests again and breaks, that would be an initial sign of weakness.
NDX daily chart:
I’m skeptical about the bear case here, as the setup isn’t strong, and the timing was a lot better a month or even a fortnight ago. As long as the daily middle bands are holding as support across the board on the equity indices, there’s not much to see on the bear side. If those start breaking with any confidence, I’ll look again at possible downside targets.
If you like my analysis and would like to see more, please take a free subscription at my chartingthemarkets substack, where I publish these posts first and do a short premarket review every morning.
