On election day I was writing that the huge news this week would likely dominate the markets, and the first and larger part of the news is in, with Trump elected President again, and markets breaking higher in response.
I was also writing a few days ago about two unfinished business targets above that I was expecting to see hit within weeks and they were a new all time high on QQQ (done), a retest of the 2024 high on IWM (done) and possibly a retest of the 2021 all time high on IWM (also done). That has cleared out the unfinished business targets above so today I’m going to be looking at possible targets higher on the US indices.
I would also note that the second big ticket item on this huge news week is at 2pm EST today and that is of course the Fed decision on interest rates. The market consensus seems to be for a cut of 0.25% which I’m leaning towards too and, unless that is much different, I’m expecting that the market reaction to the news will be considerably more muted than the reaction to the election news.
In the short term there is quite a bit of short term negative divergence on hourly futures and RTH 15min charts on the US indices and I was saying in my premarket video this morning that we might well see some retracement of the big up moves in the last couple of days this morning. So far there has been no sign of that happening but we might still see some of that before the Fed announcement, or in reaction to it.
ES Dec 60min chart:
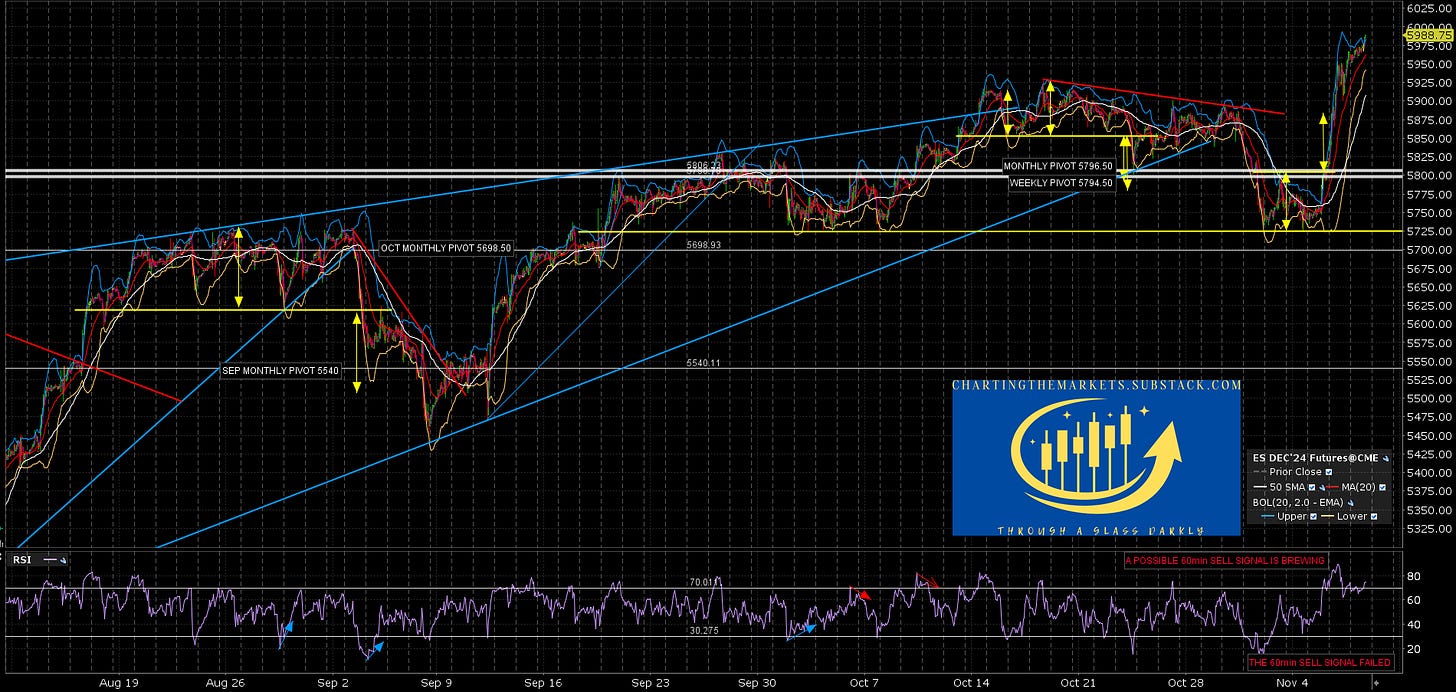
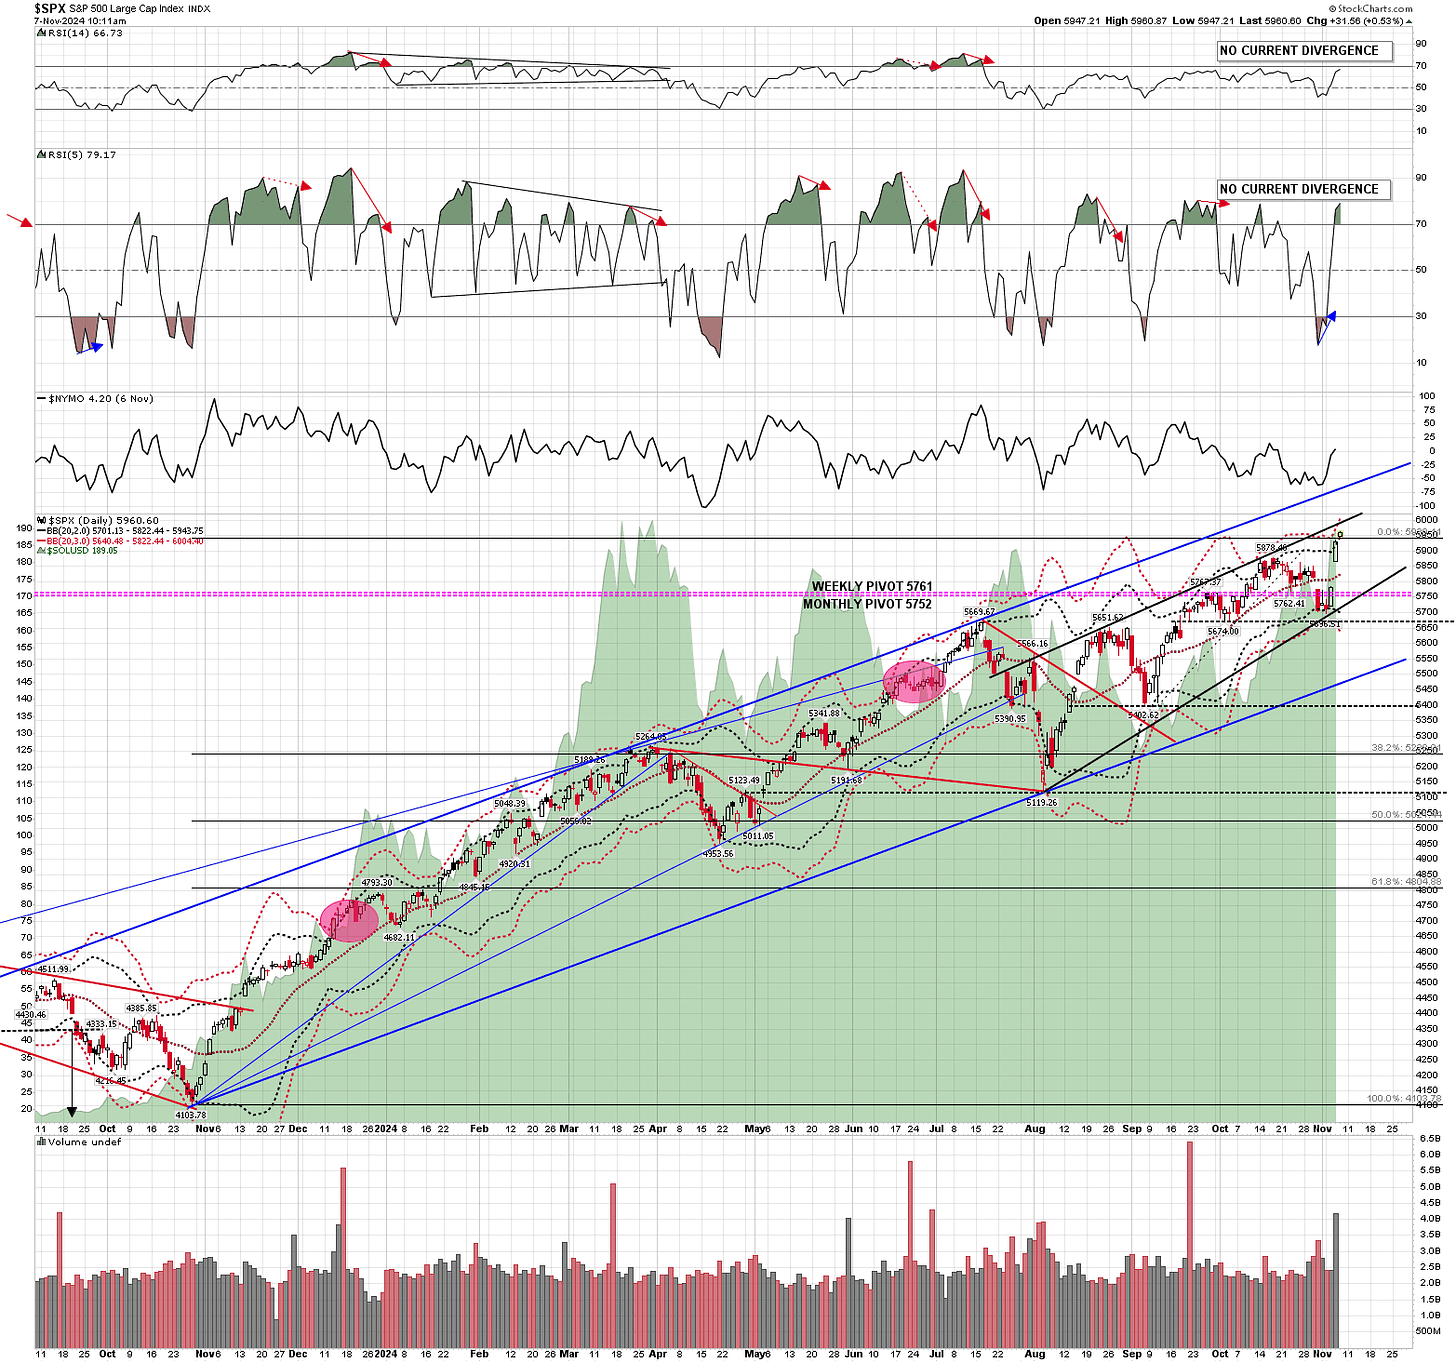
On the SPX chart I first mentioned in August that there was a large channel on SPX and that the channel resistance was the obvious next target on a strong move higher. I now have that in about the 6120 area and I have pencilled in as a target to be hit by the end of the year.
There is a shorter term rising wedge from the early August low though, with resistance currently in the 5990-5 area, and if that is hit in coming days I’ll be watching that area for resistance, particularly as it is currently a match with the 3sd upper band.
SPX daily chart:
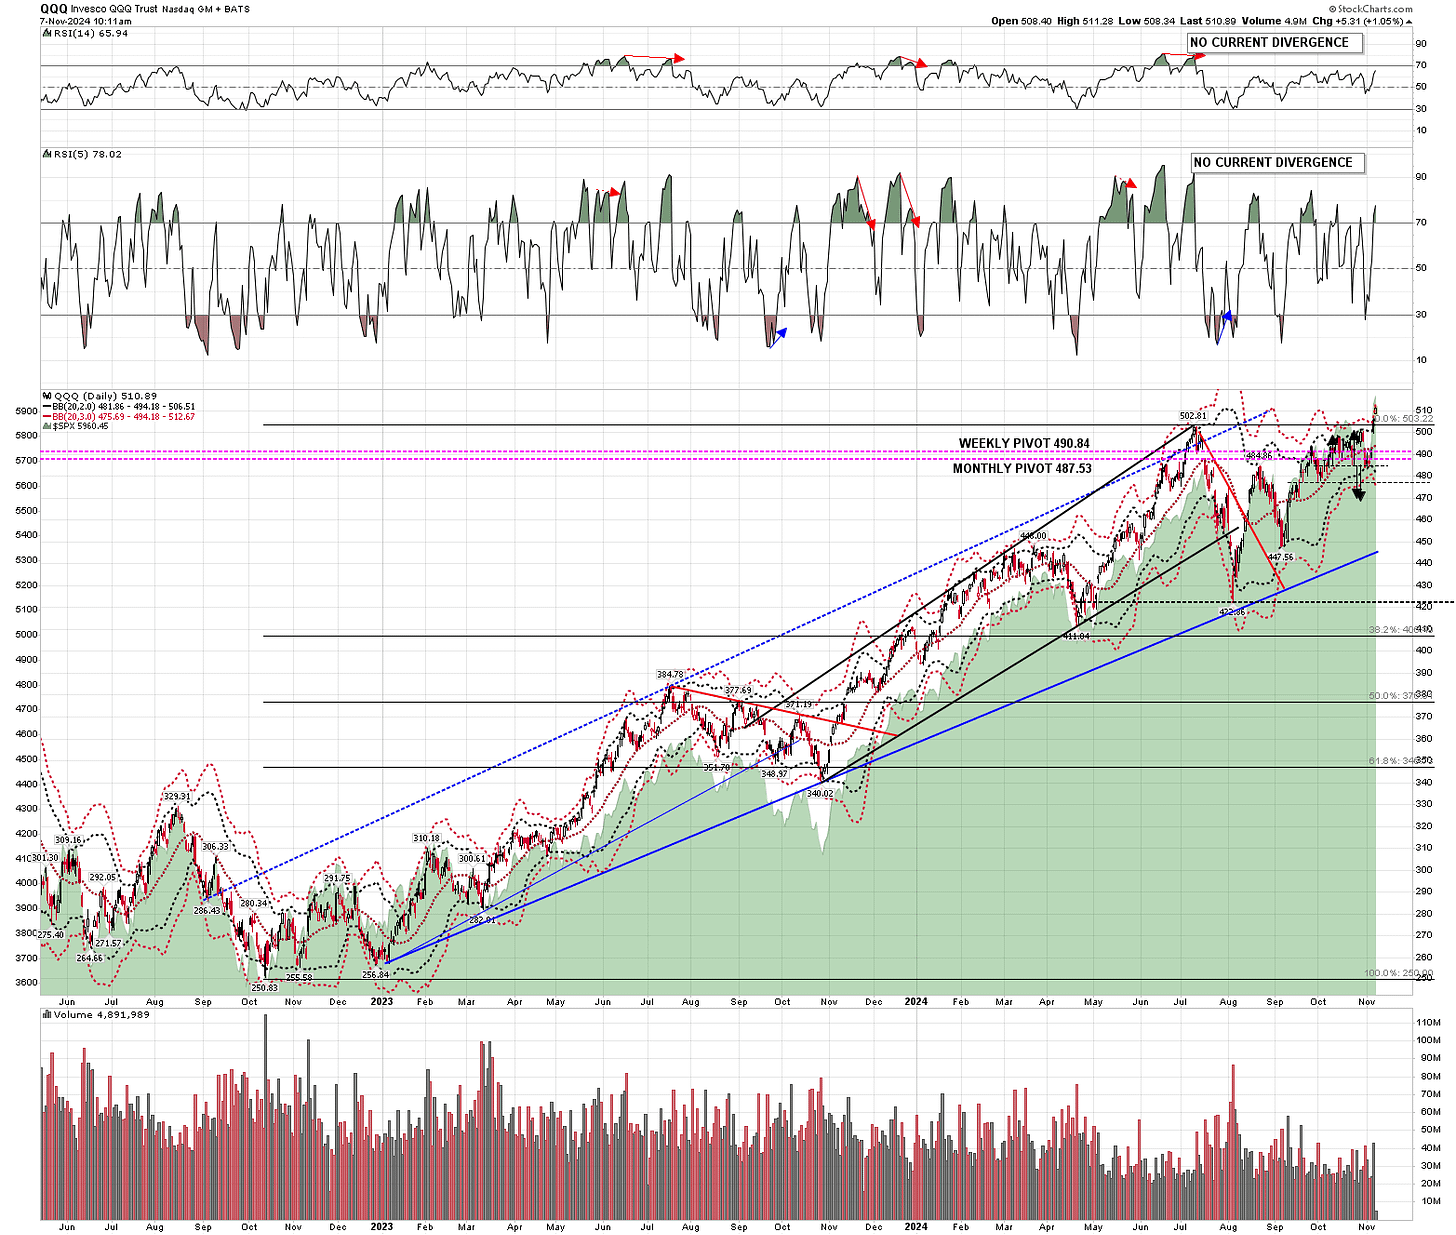
On the Qs I don’t have any obvious resistance trendline targets above, but I would note that the 3sd upper band has been hit both yesterday and today. That is usually a sign that some short term consolidation lasting at least three or four days is close and means that Tech stocks are stretched here.
QQQ daily chart:
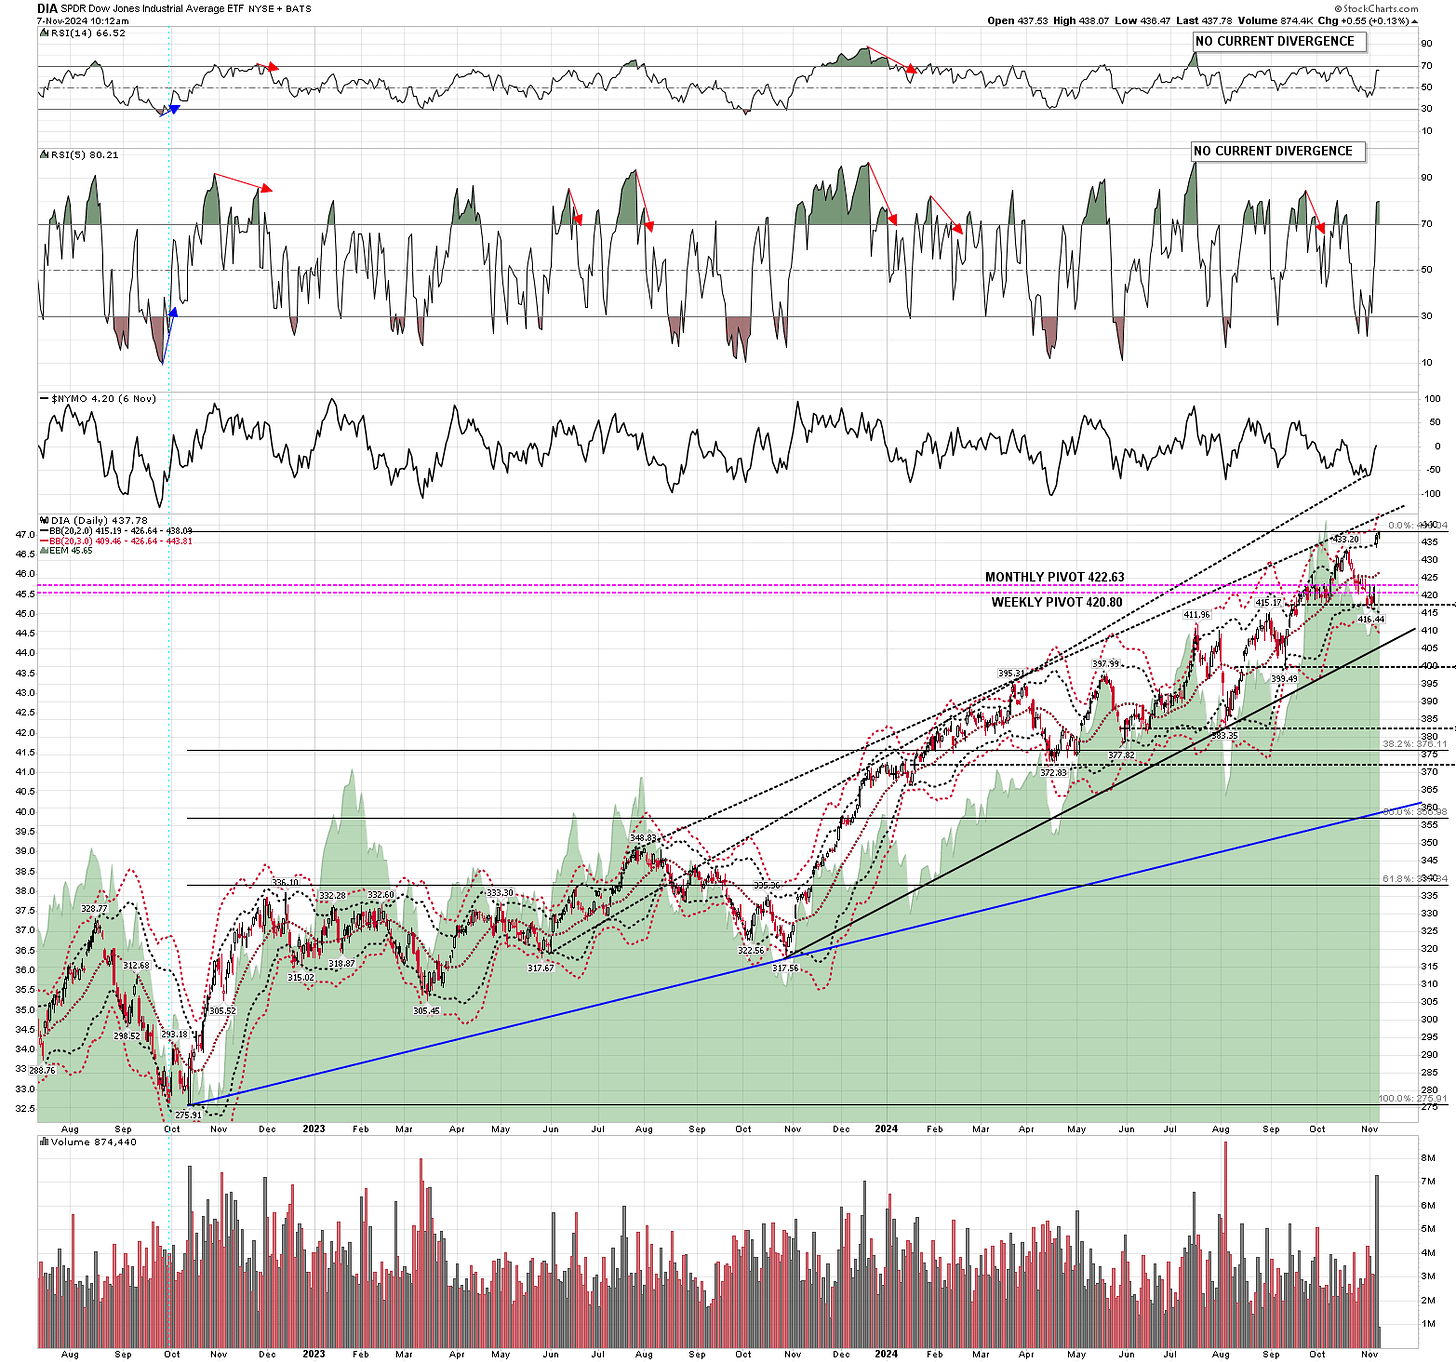
On DIA I have two decent looking resistance trendline options above. The closer is in the 442/3 area but the higher option is the better trendline, currently in the 455 area.
DIA daily chart:
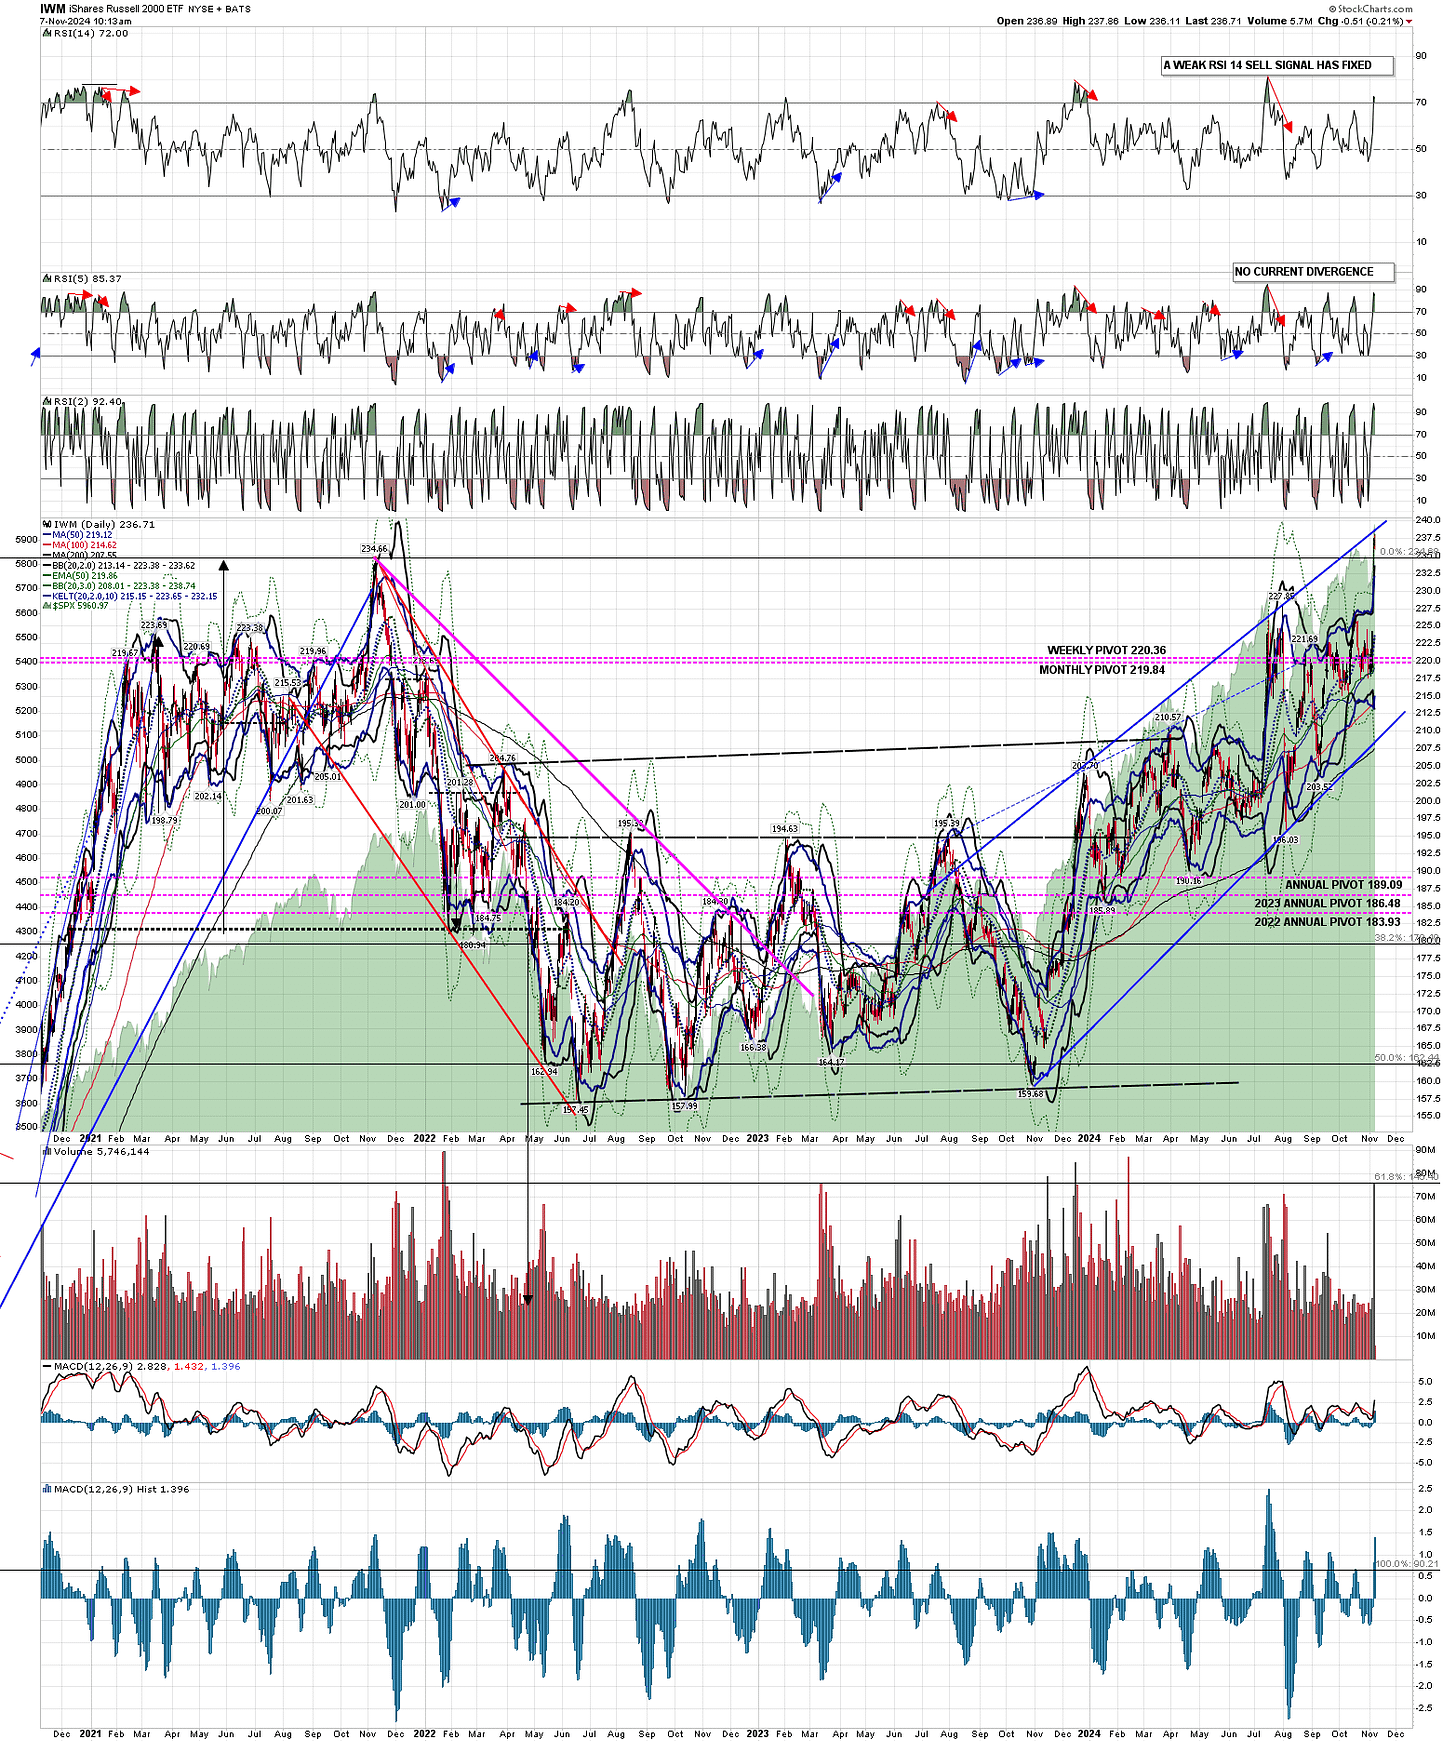
On IWM I’ve had a decent resistance trendline pencilled in for weeks now and that is being tested right now. I’m a bit doubtful about that holding long but IWM does tend to plough a lone furrow among the US markets so maybe.
IWM daily chart:
I was saying on Tuesday that if the news this week didn’t tank the equity markets then the seasonally obvious direction is still up. The markets haven’t tanked this week so far and that remains the case. The obvious direction is up into December, so we’ll see how that goes.
If you like my analysis and would like to see more, please take a free subscription at my chartingthemarkets substack, where I publish these posts first and do a short premarket review every morning.

