I saw a very interesting stat last week and I’ll talk about that first this morning. The stat was at marketwatch.com and you can see the article here. I’ve been looking hard at this and have a few comments to add in the current instance.
I would say first that I have not checked whether the statistic itself is correct and am assuming that the bare facts that these series have only occurred at these times since 1970 are correct. I think that is a reasonable assumption however, so am proceeding on that assumption unless I receive strong evidence to the contrary.
I have no issue with the basic conclusion with the article, that a series like this is found at or near the end of a decline, that it means that extensive further downside this year is unlikely, and that, with less confidence, the odds favor SPX being higher in a year than it was at the 1930 level reached at the close on 17th February, which was the last of this three day series in 2016, are pretty good.
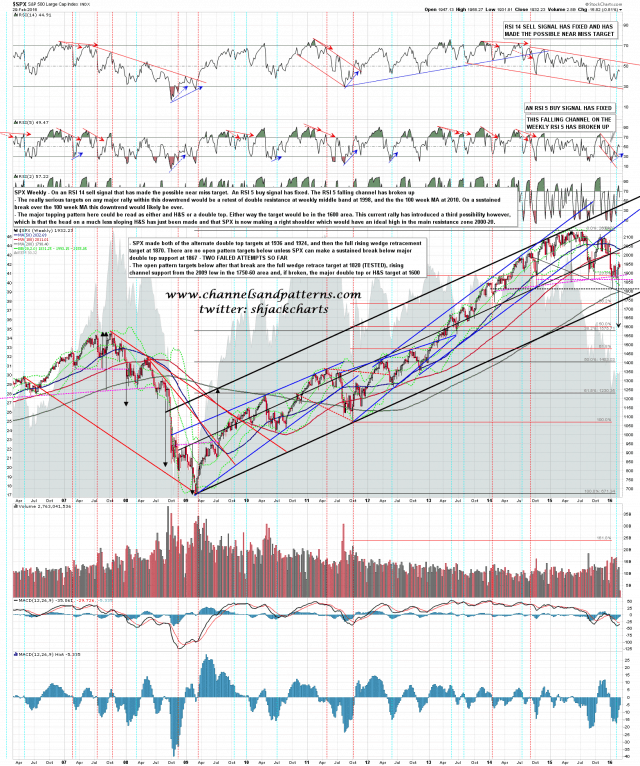
This would be a decent match with Stan and my primary scenario this year, which is that the bull market from the 2009 low has not yet ended, and that this is wave 4 of that bull market, with a wave 5 that should at least retest the 2134 high either starting now or likely to start soon. The dividing line for that count is rising support from the 2009 low, currently in the 1760 area, and that could still be the main target for this move.
What I would note on this stat however is that of the seven previous instances since 1970, excluding the second instance in 1987 as that was just confirmation, five of the seven, all except 1982 and 1984, retested the previous low afterwards, and that of those five, the retests in 1987 and 2002 both made new lows, albeit new lows that were fairly marginal and not sustained long. The odds still favor an attempt at retesting the 1810 low, and that support trendline in the 1760 area is still potentially in range.
The other two things to note here, both also noted by the article author, are that the 2016 series is the weakest of all of the series listed. That doesn’t seem to have affected performance in the next weakest instances in 2011 and 1984 though. The last point is the very weak start to this year, and I am in full agreement there, as my January stats are calling for a flat 2016 at best as I explained in my post on February 1st. That said, my stat gives a range up to 3% higher than the 2014 closing print, and as that was at 2044, that gives a range up to 2105, some 9% above 1930.
The last point I would add here is that rising support from the 2009 low is very much the obvious target for this move, and that a failure to hit it on this move would leave it as unfinished business below. That would likely limit any move up from here to being either a retest of the 2134 high or a higher move to make the high on an H&S head with the 2134 high being the left shoulder high. After that move we should then see the bear market that the move this year so far probably isn’t, and that move would likely be next year. SPX weekly chart:
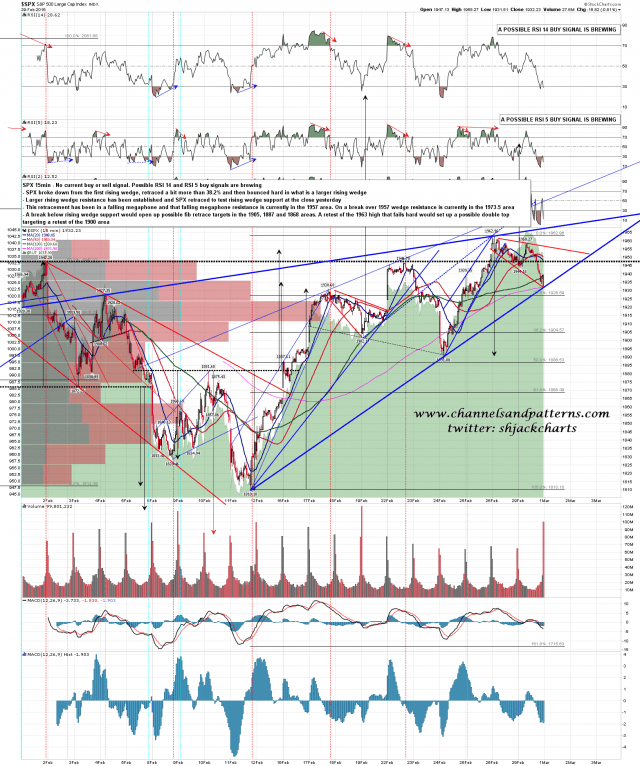
Back to the short term and SPX tested rising support from the 1810 low at the close yesterday, so a rising wedge from there is now fully established. The obvious next targets on a break over short term declining resistance in the 1957 area. On a break above the next targets would be a retest of the 1963 high and wedge resistance, currently in the 1973-5 area. The rising wedge is a 70% bearish pattern of course. SPX 15min chart:
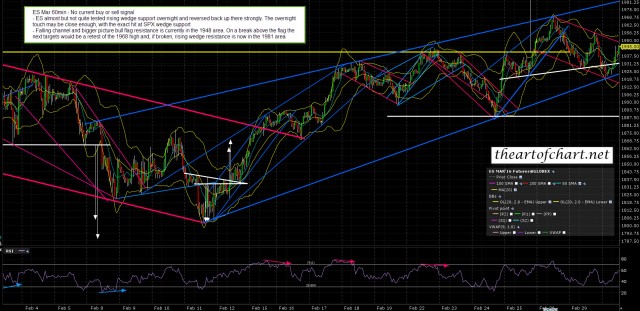
ES also made a decent rising wedge support test and the levels are on the chart. ES Mar 60min chart:
A larger retracement than the one we have seen the last couple of days is likely soon on this setup. If we see a break over short term falling megaphone resistance in the 1957 area this morning that larger retracement should be preceded by at least a retest of the current rally high at 1963.


