
Chart patterns are the basis for breakout trading, as most (if not all), breakout trades are actually instances of price breaking out of a pattern when the pattern completes. Finding and correctly identifying chart patterns is the first step of preparing the trade. The right pattern must be clearly identified, as there are many instances where something looks like the pattern but in fact is not a pattern.
Usually, chart patterns are divided into continuation and reversal patterns. Reversal patterns are inherently flamboyant–at every market top, and at most market bottoms one finds a reversal pattern. But be careful: just because there is a reversal pattern at every market top, it does not mean that every reversal pattern is a market top. This is an extremely important point–you can think of it like this: just because every dog is an animal, it does not mean that every animal is a dog!
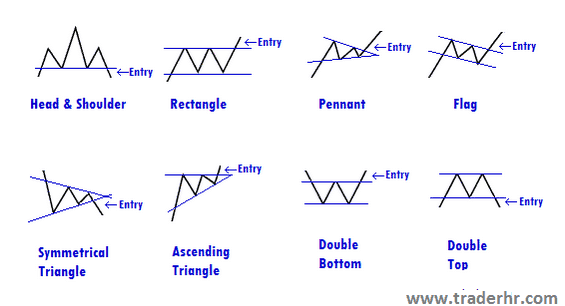
So, be careful about reversal patterns, and do not get overly confident with them. Continuation patterns are generally a much more healthy way to trade, giving you more room to be wrong and still be in the direction of the trend. They represent consolidation, and if the trend is strong, you will often get a better trade out of them. The catch is that they are sometimes highly counter-intuitive. Finally, we give the illustration of most major (i.e. most common), chart patterns.
Sinisa Persic, CMT – TraderHR.com

