
The Bomb after the Bomb (Not a FORECAST)
Over the weekend I have had a thread in my mind that I needed to pull on. I will start with the chart as I am a visual person and visual learner.
What are we looking at below? This is the layered chart of the USD vs the $TNX which tracks the 10 yr yield.
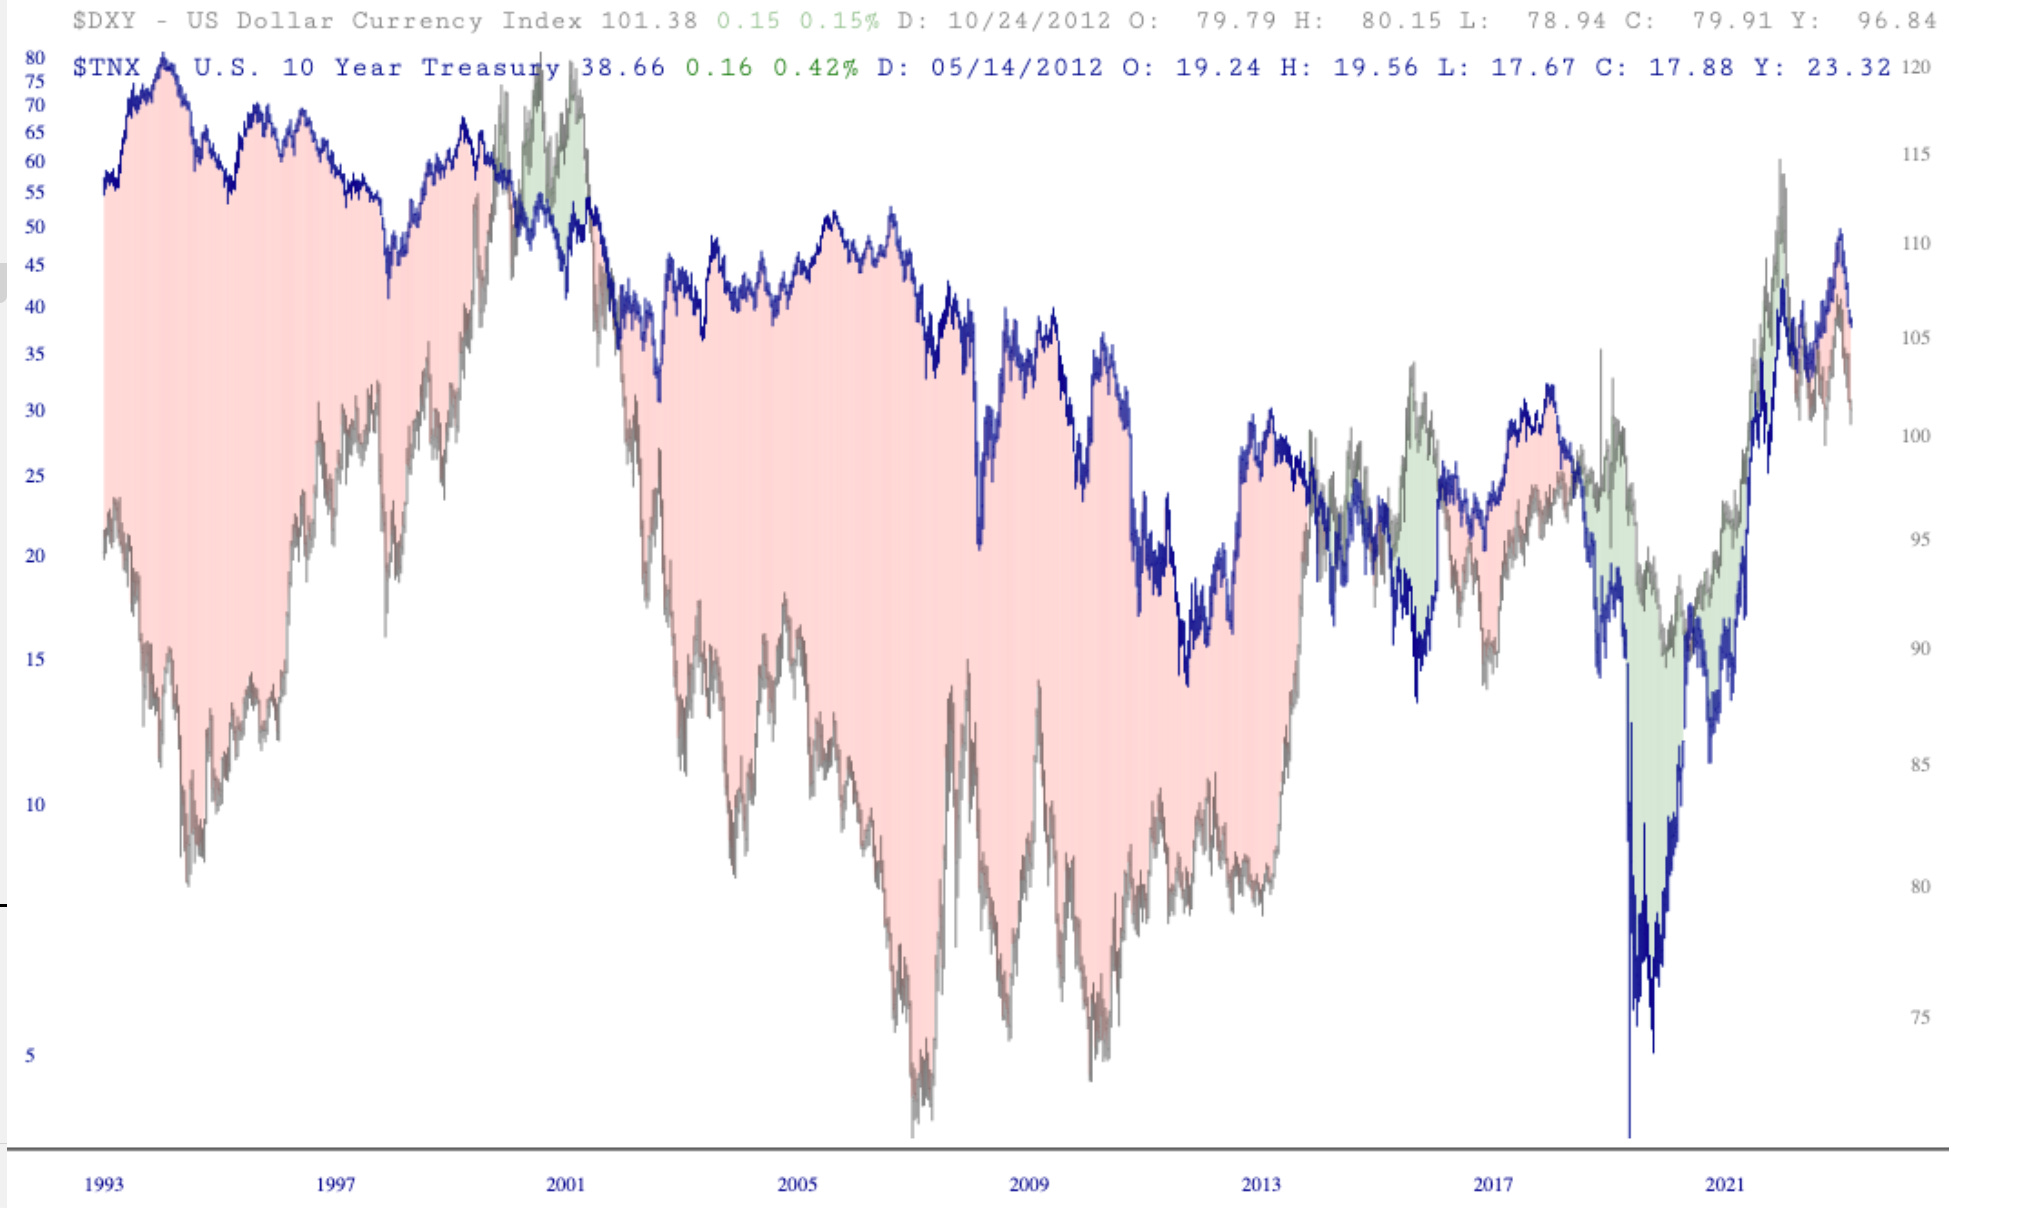
The current pairing of yields and the dollar are in lock step since Covid. Yields up = USD up and bond prices down. But if you look at the whole picture the USD and Yields were not trading in the same direction and there was a wide gap between the two.
My thesis and what I will be watching is that we may be entering a period where Yields and the USD diverge and don’t trade in lock step or even in the same direction!
We might see Yields rise and USD fall, vice versa.
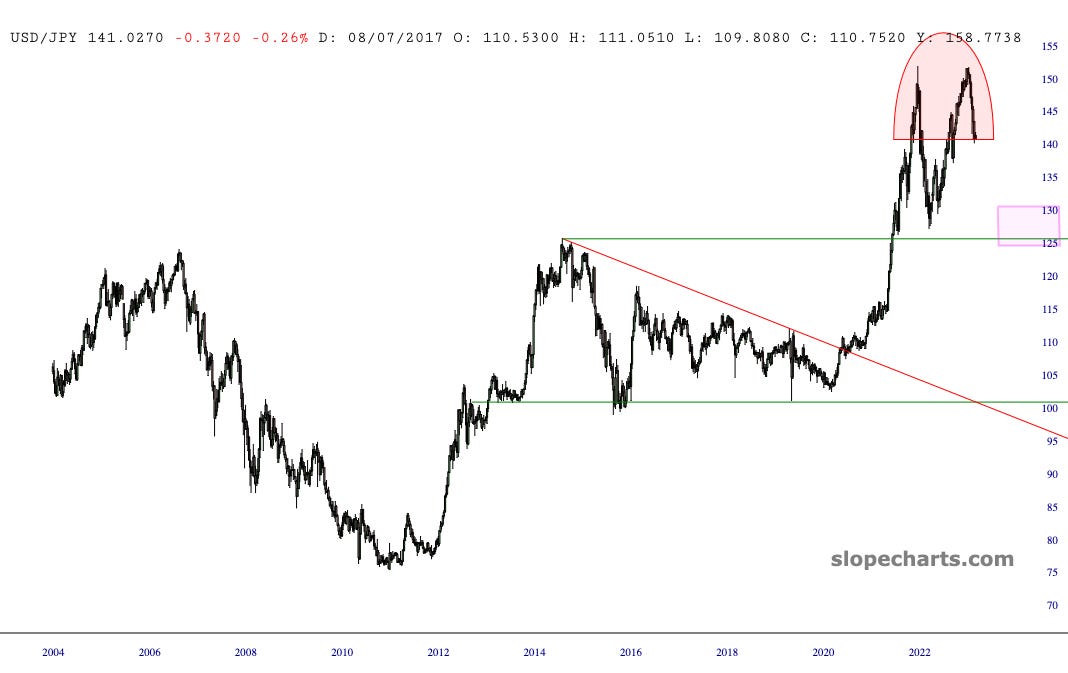
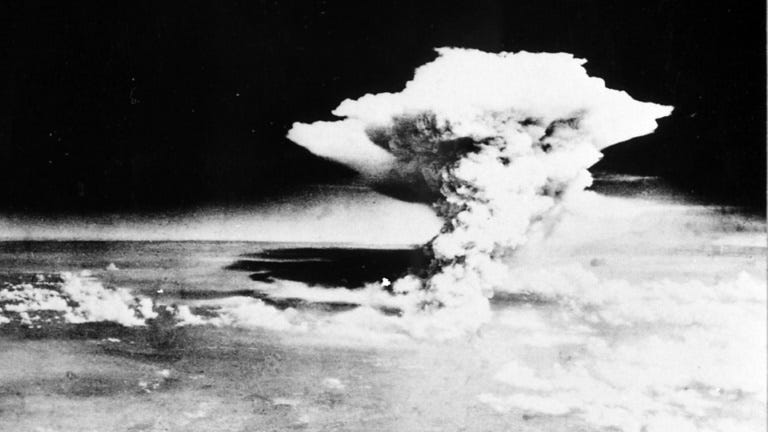
Bonus. Look at the USD/JPY above. Also known as the carry trade. You think US has inflation? Look at the Yen pair. I often wonder if Japan has become our central bankers slaves, after the A Bombs were dropped during WWII. Their hyper inflation, low birth rates, low marriage rates and demographics are so curious to me.
Even their love for Americana, Denim/Levis, USA reproduction military clothing.
Was it all a psychological impact after the physical impact of a conquered people? Why would their government and central planners agree to the carry trade? Why would they keep printing their Yen to oblivion to allow Bankers to short the Yen and go long risk assets?
Keep a close eye on this currency pair. The chart looks like it is toppy for the USD. If you take all of the above data and assume the US’s only option is to keep printing, then you might see the USD fall hard even with interest rates spiking.
