
Well, hello 2024. A lot to talk about already in this new year, but I’ll start off with my favorite chart these days… RTY. Below is the daily chart of /RTY. Let’s start off by taking a look at the value area and POC for this month.
- Value High: 2030.4
- Value Low: 1798.2
- December POC: 1866.1
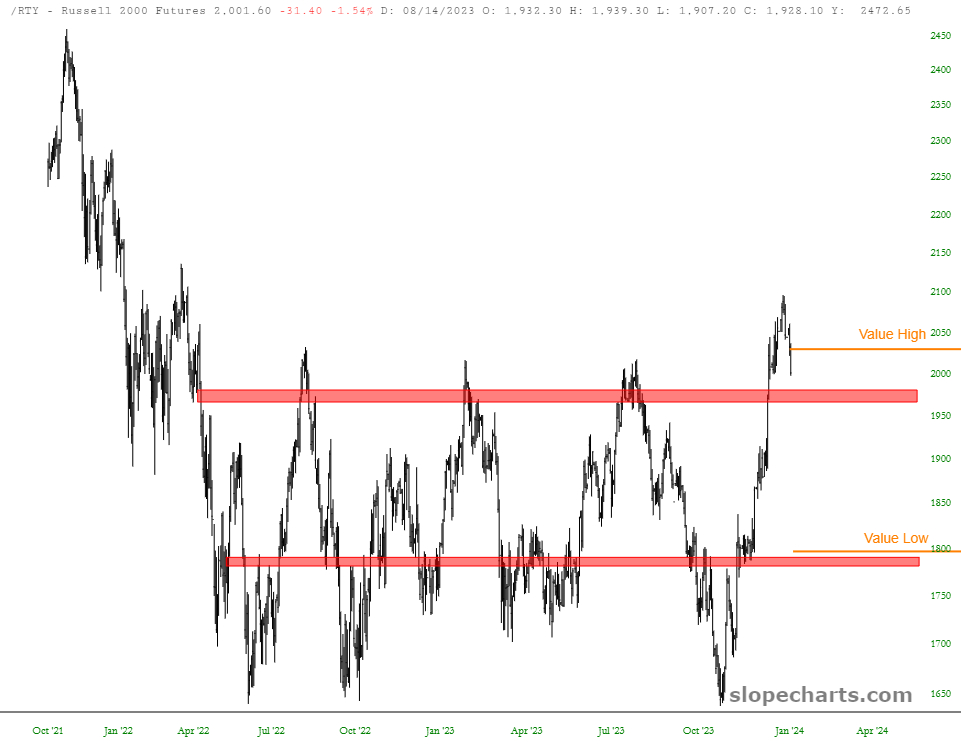
/RTY made its short term top on 12/27/23, and has been moving down each of the past four sessions. Of note today, /RTY moved aggressively below value high at 2030. This opens up some interesting possibilities for this month. First, a move below value high opens up the likelihood that /RTY moves all the way back down to value low by the end of the month. Second, I have noted in the above chart two red horizontal lines. These are where the two primary clusters of POCs are located. The top red box has a cluster of two monthly POCs. The bottom red box is more powerful, contained five POCs.
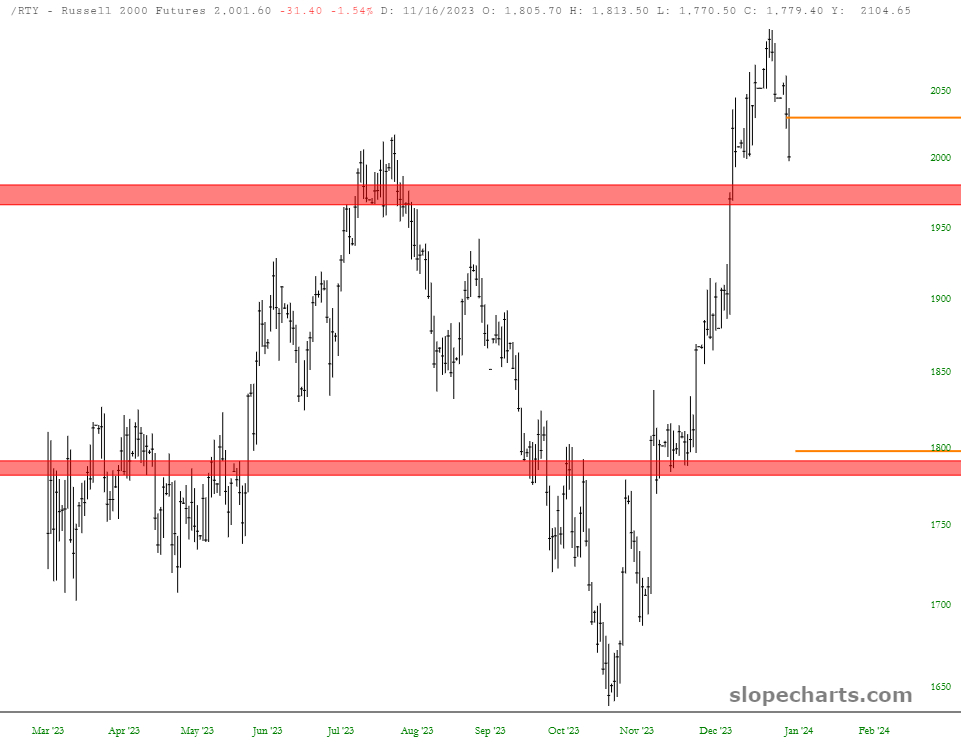
Zooming in a bit on the chart you can see a better look at how January is beginning to shape up. The /CL to /ES ten year analog was forecasting an aggressive, but brief bearish move to begin 2024. I will continue to respect that, and look for this move to only last a couple weeks to begin the year. At the moment I wouldn’t expect /RTY to trade below value low this month. If /RTY manages to break below value low and the bottom cluster of POCs, than that would be a signal to me that a more powerful move is taking shape.
To close, enjoy the musical stylings of Rochford, England’s own son… Jamie Cullum.
