
There’s no need to overcomplicate 2024. There is a single indicator with a perfect track record of recession, correction or bear market: the spread between the 2-year and 10-year yield.
Since everyone is familiar with the spread chart, I’ll show the ratio instead.
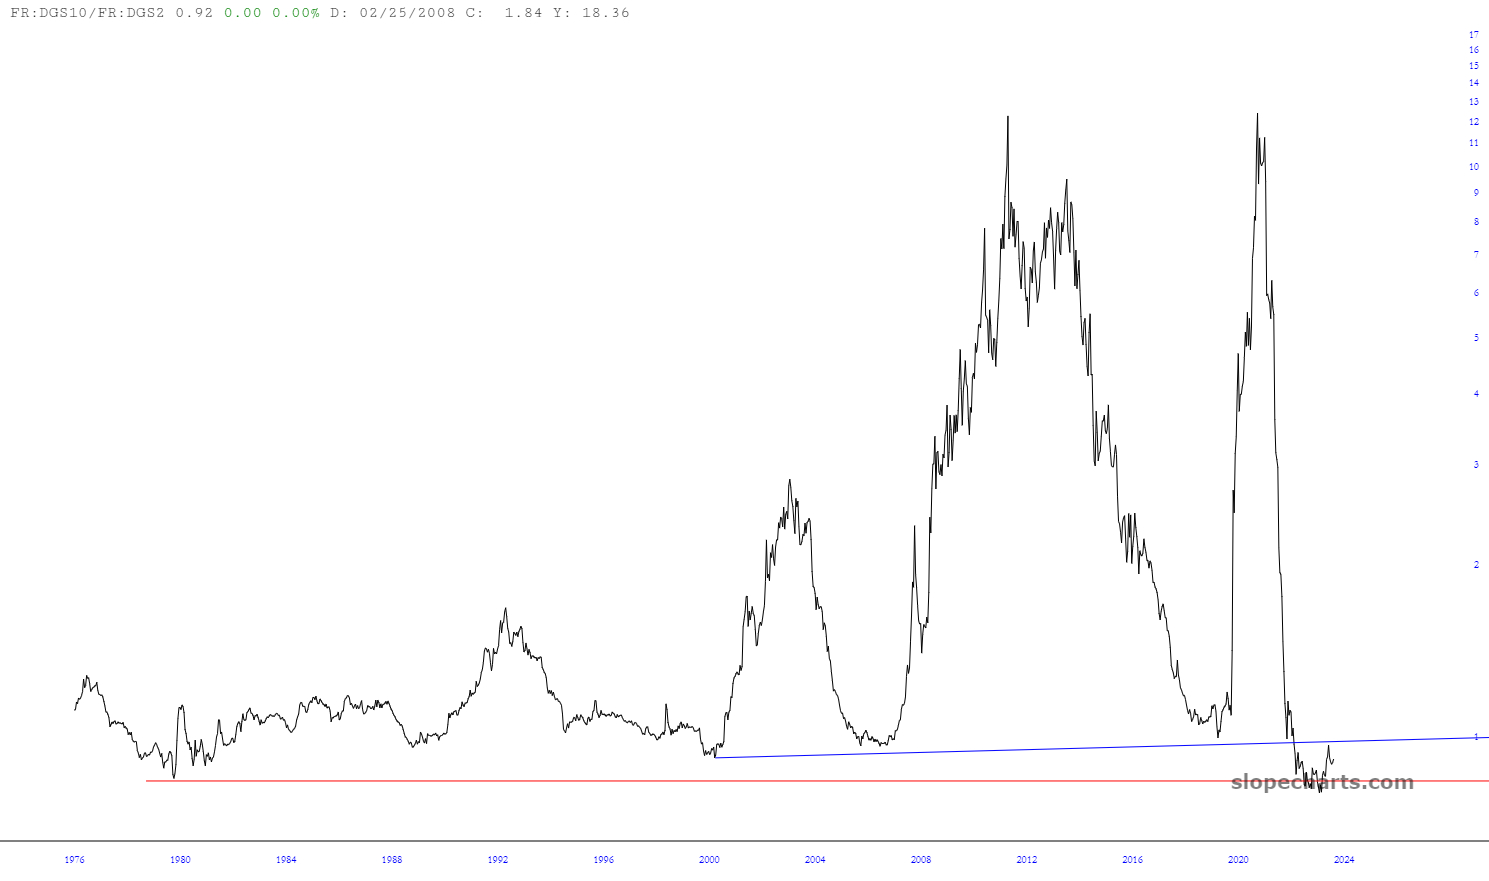
This chart better represents two important factors from the past 40 years. First, interest rates were falling. The rising ratio is a consequence of the 2-year yield trending towards zero in each subsequent recession. Second, the increasingly interventionist central bank. This ratio goes “off the chart” if the 2-year goes to zero or below. It starts having lower peaks if extraordinary monetary policy, or at least the disinflationary kind, is in the rear view mirror. That potential double-top on the chart is a warning that rates have shifted into a new uptrend.
The 2s10s gets a bad rap because many analysts predict recession when the steepening starts, but sometimes the steepening is a fakeout. In late summer 1998, spring 2006 and in spring/summer 2023 there were steepenings and recession fears, but the curve would eventually invert again before steepening. The prior two examples were the two largest bear moves of the past 50 years.
Here’s the 2s10s spread with the 12-month change in the Wilshire 5000. Markets typically peak before the recession.
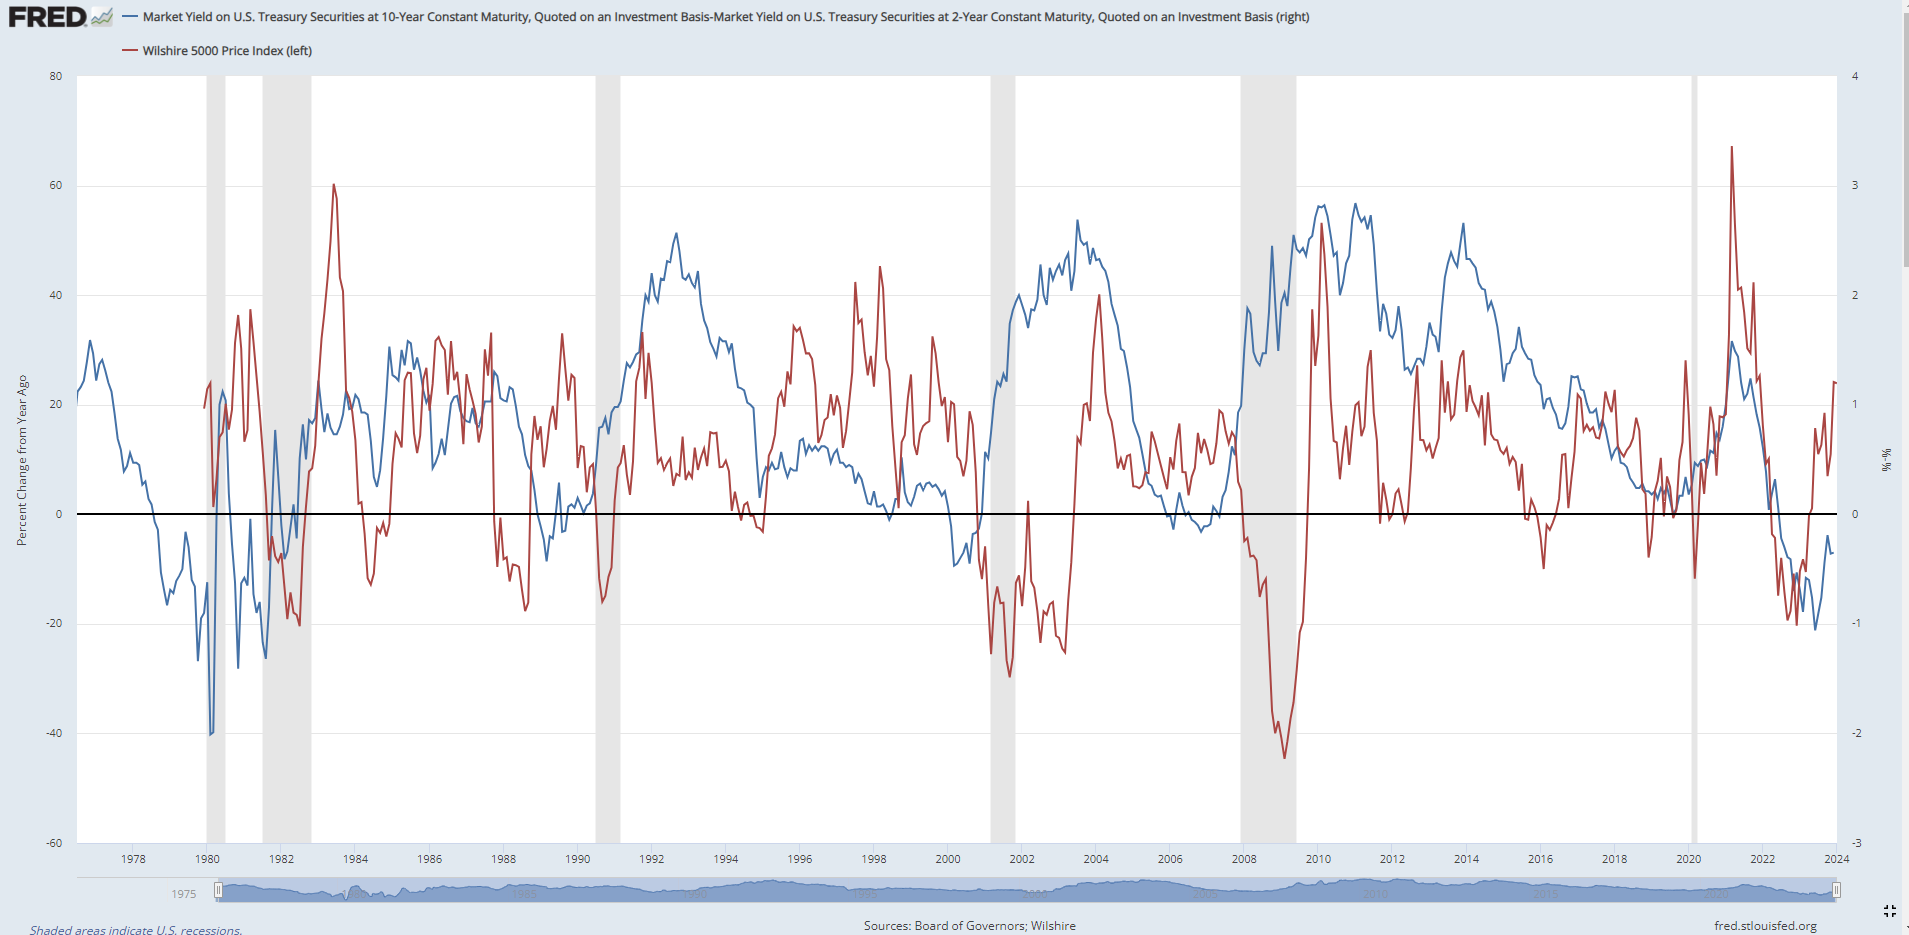
I thought July 2023 might be the top because the steepening took off, but it wasn’t to be. Still, the market tracked almost perfectly with the 2s10s. When it is rising, stocks drop. When it drops, stocks rally.
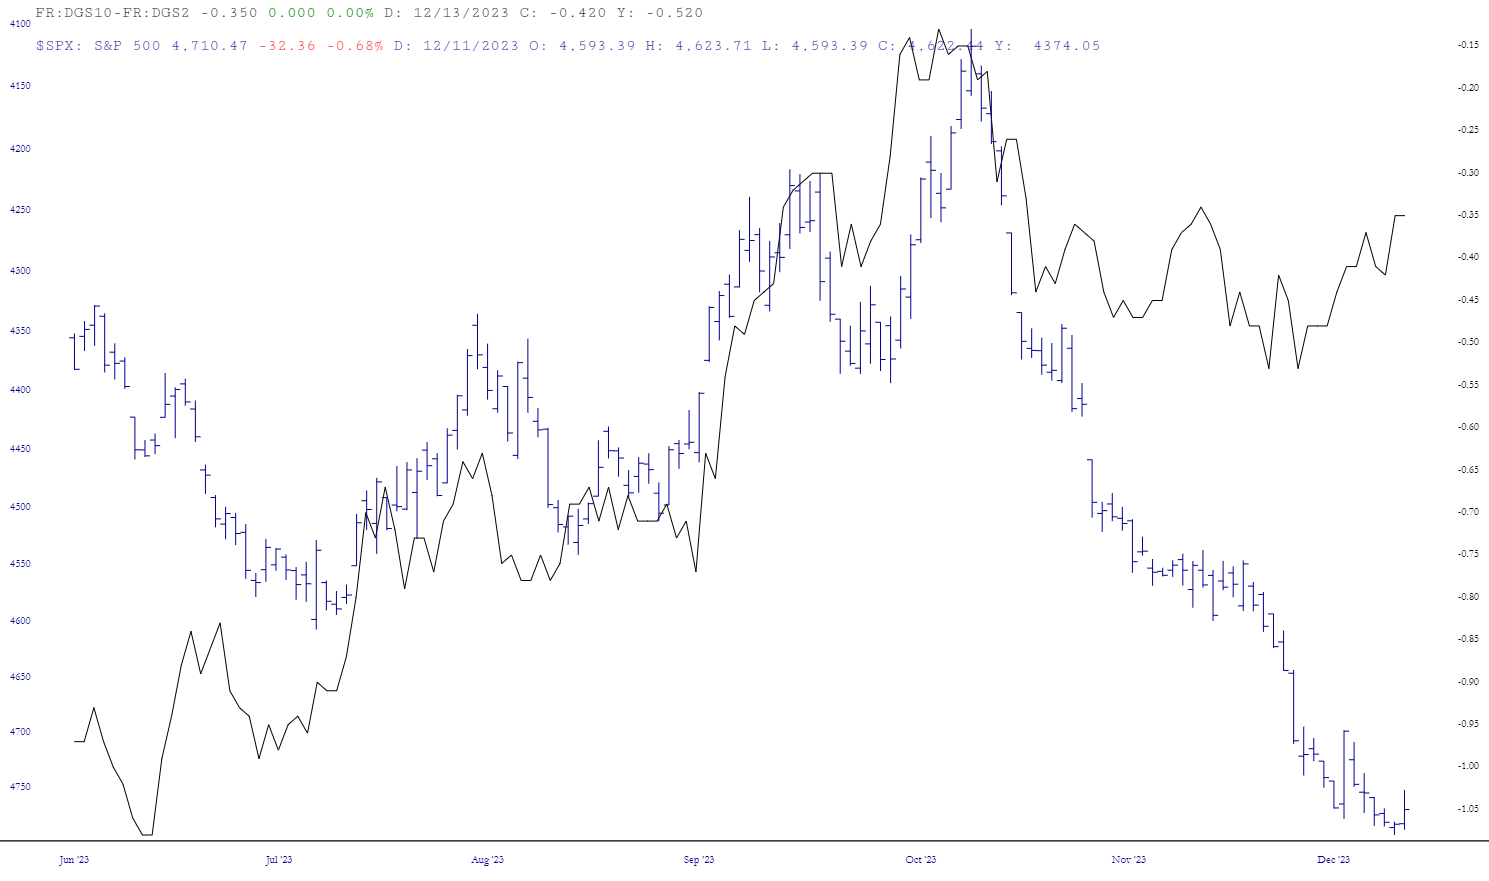
The move in equities in November and December was extreme versus the yield curve. The level of the curve isn’t proportional with stocks, but if it was, the steepening since December 18 is already enough to call for a 10% market correction. If the steepening continues, much greater losses are in store.
Finally, look at the spread between the 2-year and Fed funds rate. It’s as large or larger-than the three prior rate cut cycles.
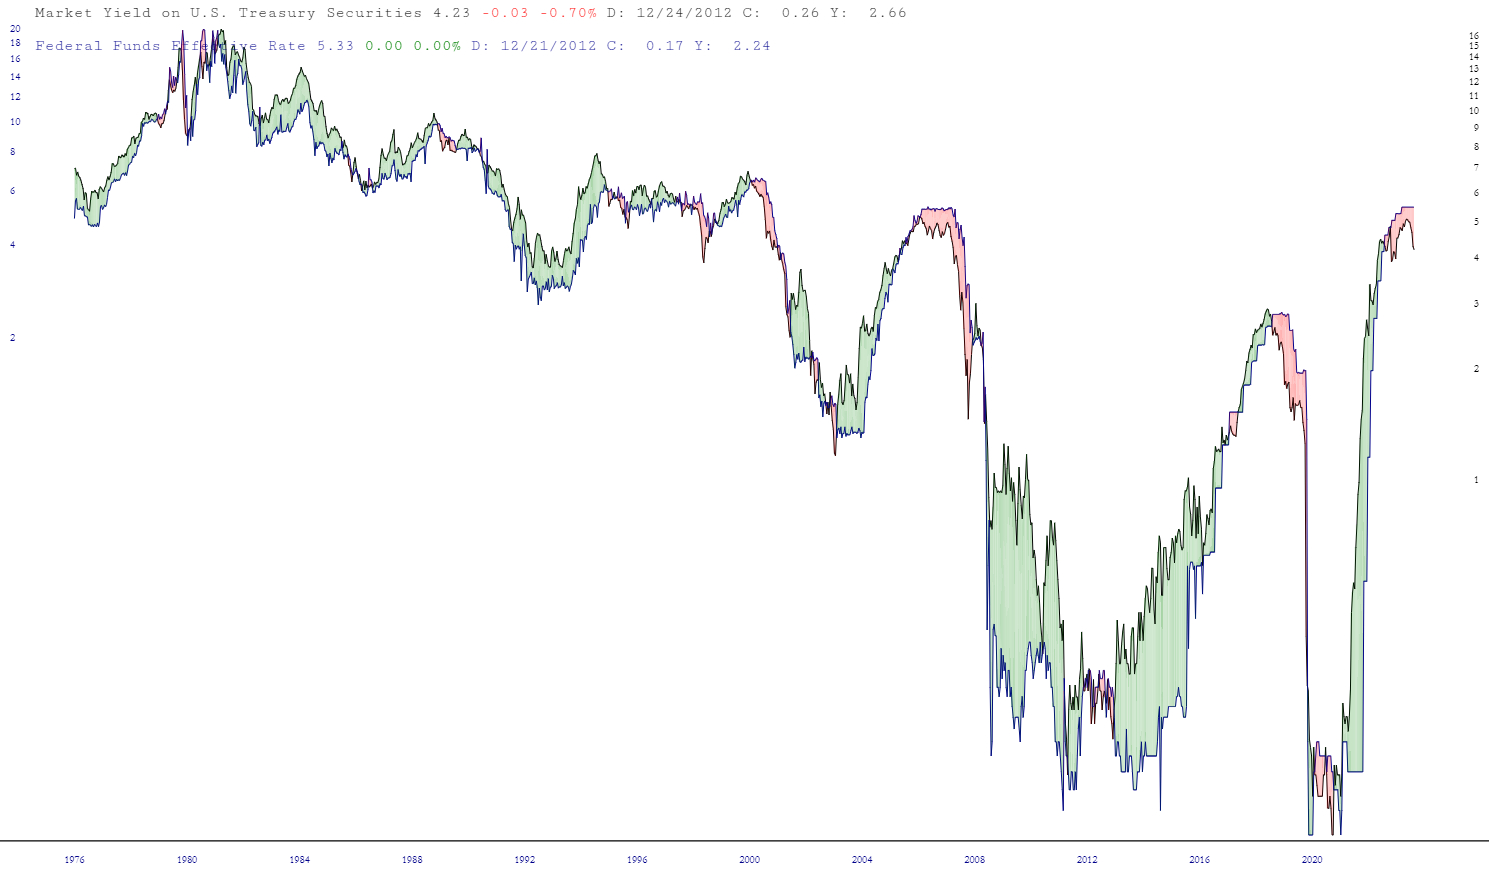
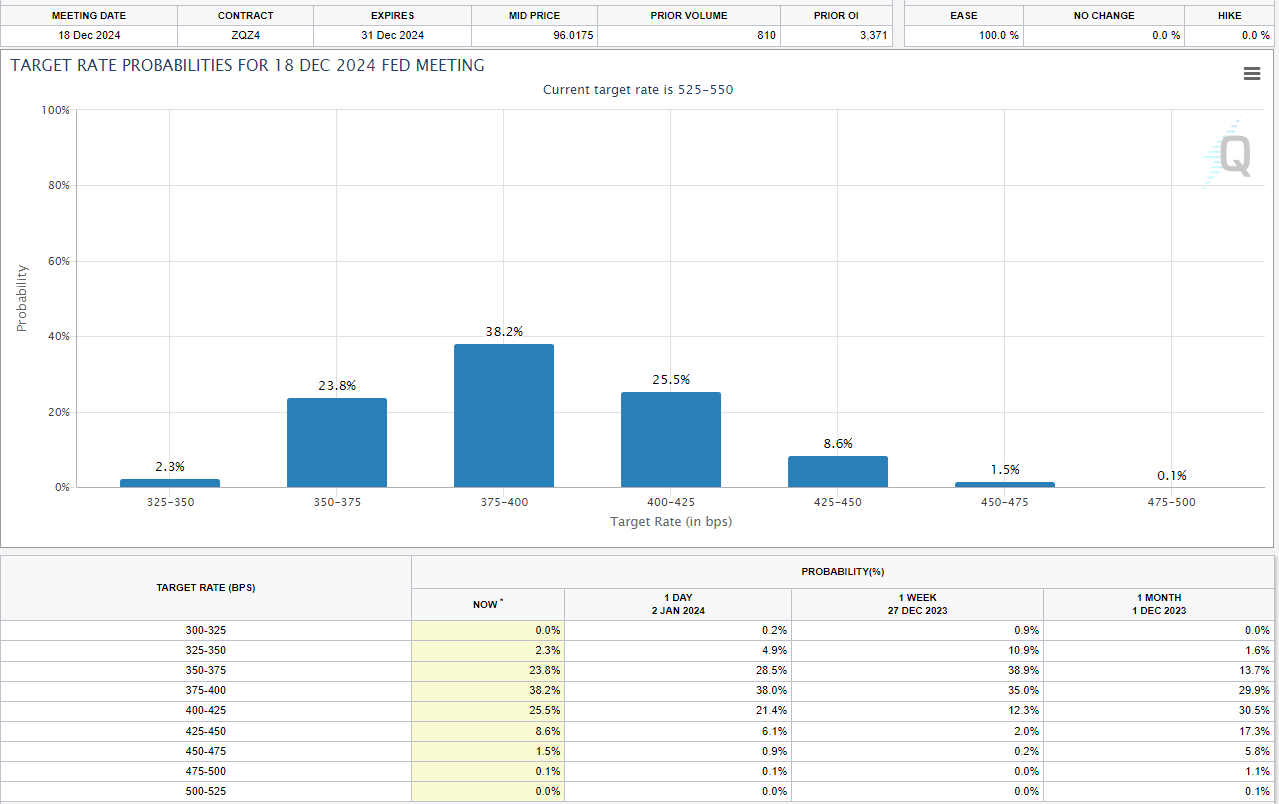
Fed funds futures contracts are pricing in 125 basis points of cuts by December 2024 (90% of speculators are betting on at least 125 basis points in cuts from current 5.25-5.50 down to 4.00-4.25).
I can’t predict with 100% accuracy how the 10-year yield will react when rates come down, but as of today, 40 bps of steepening would flip the 2s10s spread to positive. If inflation isn’t about to U-turn (itself bearish for stocks), history says a continuing bull market requires the 10-year falling in lockstep with the 2-year aka Goldilocks. Since falling rates are seldom positive in the longer-run, the better scenario for bulls would be: the market is wrong about the 2-year falling. Rates remain high, but stable. Since bulls have already priced in cuts though, a sharp, temporary correction in stocks is coming even in the best case scenario for bulls.
The bull scenario assumes the 2-year Treasury yield is falling for a different reason than in the past. It really is a “this time is different,” Goldilocks scenario. Otherwise, as in 2000, 2007 and 2019, the bond market is not signaling cockeyed optimism in the economy, but an oncoming recession and financial calamity. Right after most bears were blown out of the water by the most extreme bull rally since the 1999-2000 melt-up.
