Another Chasm to Close

Slope initially began as a blog, so this is where most of the website’s content resides. Here we have tens of thousands of posts dating back over a decade. These are listed in reverse chronological order. Click on any category icon below to see posts tagged with that particular subject, or click on a word in the category cloud on the right side of the screen for more specific choices.

I am fascinated by history. That’s one of the reasons I enjoy charts, because charts depict change over time. It’s also why I enjoy maps, since those embody the relationship of land and mankind, thus I have a number of extraordinary, rare maps in my home office. History is also why I enjoy politics, because politics is one of the core building blocks of history.
With that in mind, let us start by remembering something big that happened in the political world twenty years ago.
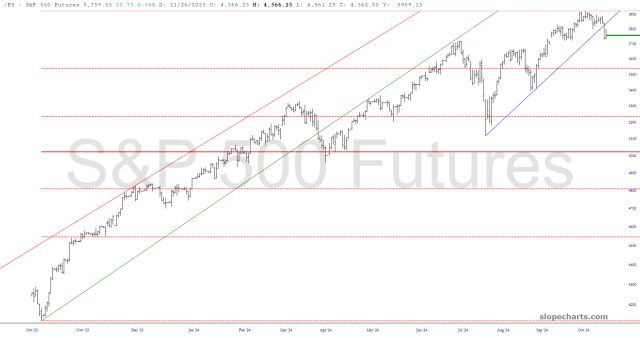
Here are a few thoughts about six futures charts, found in the captions. As always, clicking a chart makes it bigger.

Of course, there must be a (+/-) tolerance built into the time target because who among us is a legitimate Swami, able to read the future in pin-point fashion? None of us, that’s who. Least of all, those perma-wrongs that the media will one day tout in eyeball harvesting headlines.
Problem is, they never mention how long “man” was wrong before he was right. Some off brand Swamis are wrong for vast majorities of previous bull markets. Some, for all of the previous bull markets. But the media rarely let a good hook go to waste. So for the sake of ever-important credibility, I’ll supply you one historical post (of many) stating “into and through the election” for the intact economy: February Payrolls…
(more…)It is the first day of the month today, and I’ve just used daily charts in the charts posted below, as these have all the new monthly pivots marked on them. I’ll also be posting the full list including all the futures I chart at my Substack at the weekend with all the new weekly pivots as well.
This is also really the first post of two. Today I’ll be looking at possible patterns forming and resistance levels, and on Monday morning I’ll be looking in detail at the possible topping patterns forming on the US equity indices in case we are going to be seeing significant further downside.
I’m still somewhat doubtful about seeing that. November is one of the most historically bullish months of the year and based on the daily closes in the last 68 years there are just five trading days in November that have closed green less than 50% of the time, and those five are all slightly north of 49%.
(more…)