Futures ran up quite a bit yesterday and it’s possible that the low on Thursday was a very significant low. I’d give the odds of that being the case at 45% here, and we should find out by the close on Wednesday where that is the case, or whether there are new lows coming.
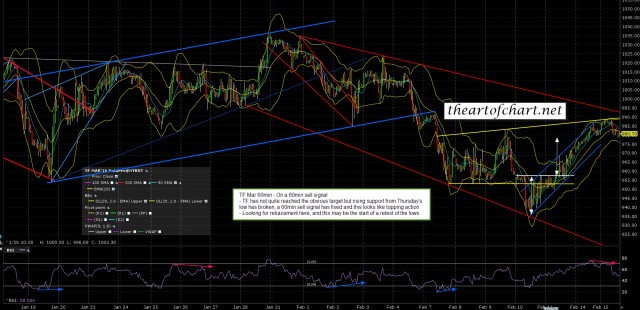
The Russell 2000 has been leading the decline, so I’ll lead with the TF chart today which, as with ES, NQ and CL, is showing a fixed 60min sell signal. Short term we should see at least a retracement here, ideally from a decent AM high. TF Mar 60min chart:
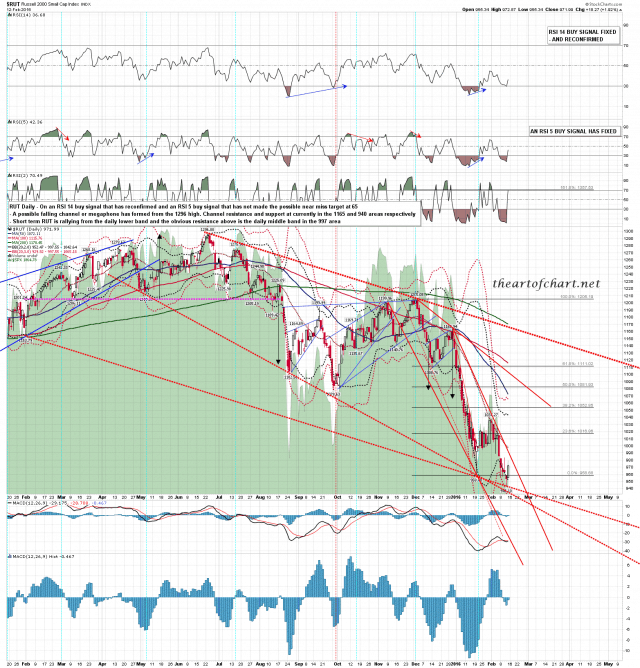
On the RUT daily chart I drew in a falling channel a while back and more downside depends on breaking that channel. The low on Thursday was at a test of channel support and if that holds and short term channel resistance is broken then we could see a big rally into channel resistance. RUT daily chart:
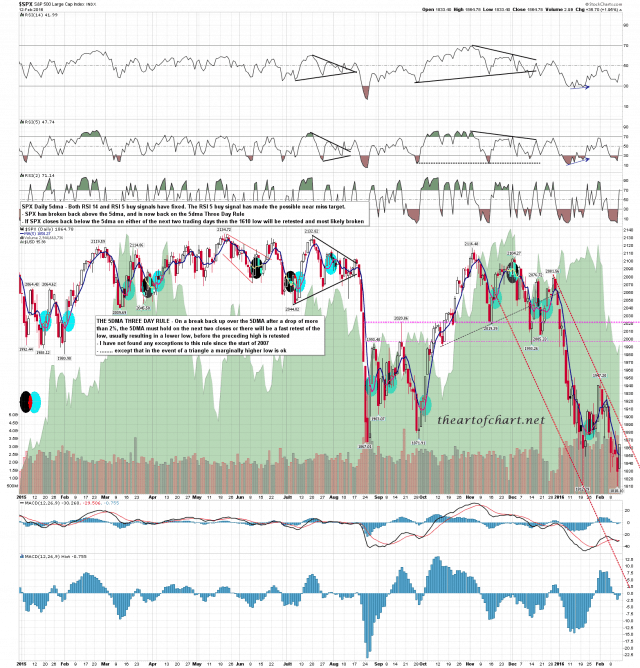
On SPX there is now a very decently formed possible double bottom and on a break over the rally high at 1947.20 that would have a target back in the 2084 area. To open up the lower targets support in the 1810-2 area needs to break. SPX daily chart:
SPX broke back over the 5dma at the close on Friday, and if we see a close back below the 5dma today or tomorrow then we’ll retest the lows and likely make lower lows. The 5dma is currently at 1856. We’ll see how far this retracement can get.


