
I’m using two of the charts that I did for theartofchart.net chart service subscribers last night and things are running pretty much according to plan, though we should still see a retest of the current rally high in regular trading hours (RTH), and obviously that can’t happen before the start of RTH. The rally may fail at that retest or run a bit higher, but so far this week everything has gone according to the roadmap that Stan and I were laying out in the public Chart Chat we did last Sunday. You can see the recording for that here, and the section on equity indices is at the start. So far the roadmaps on DX, CL, GC, ZB, NG and SB all looking pretty good as well, though the standout pattern for me was the falling wedge / bull flag setup I was showing on TLT which has been delivering beautifully.
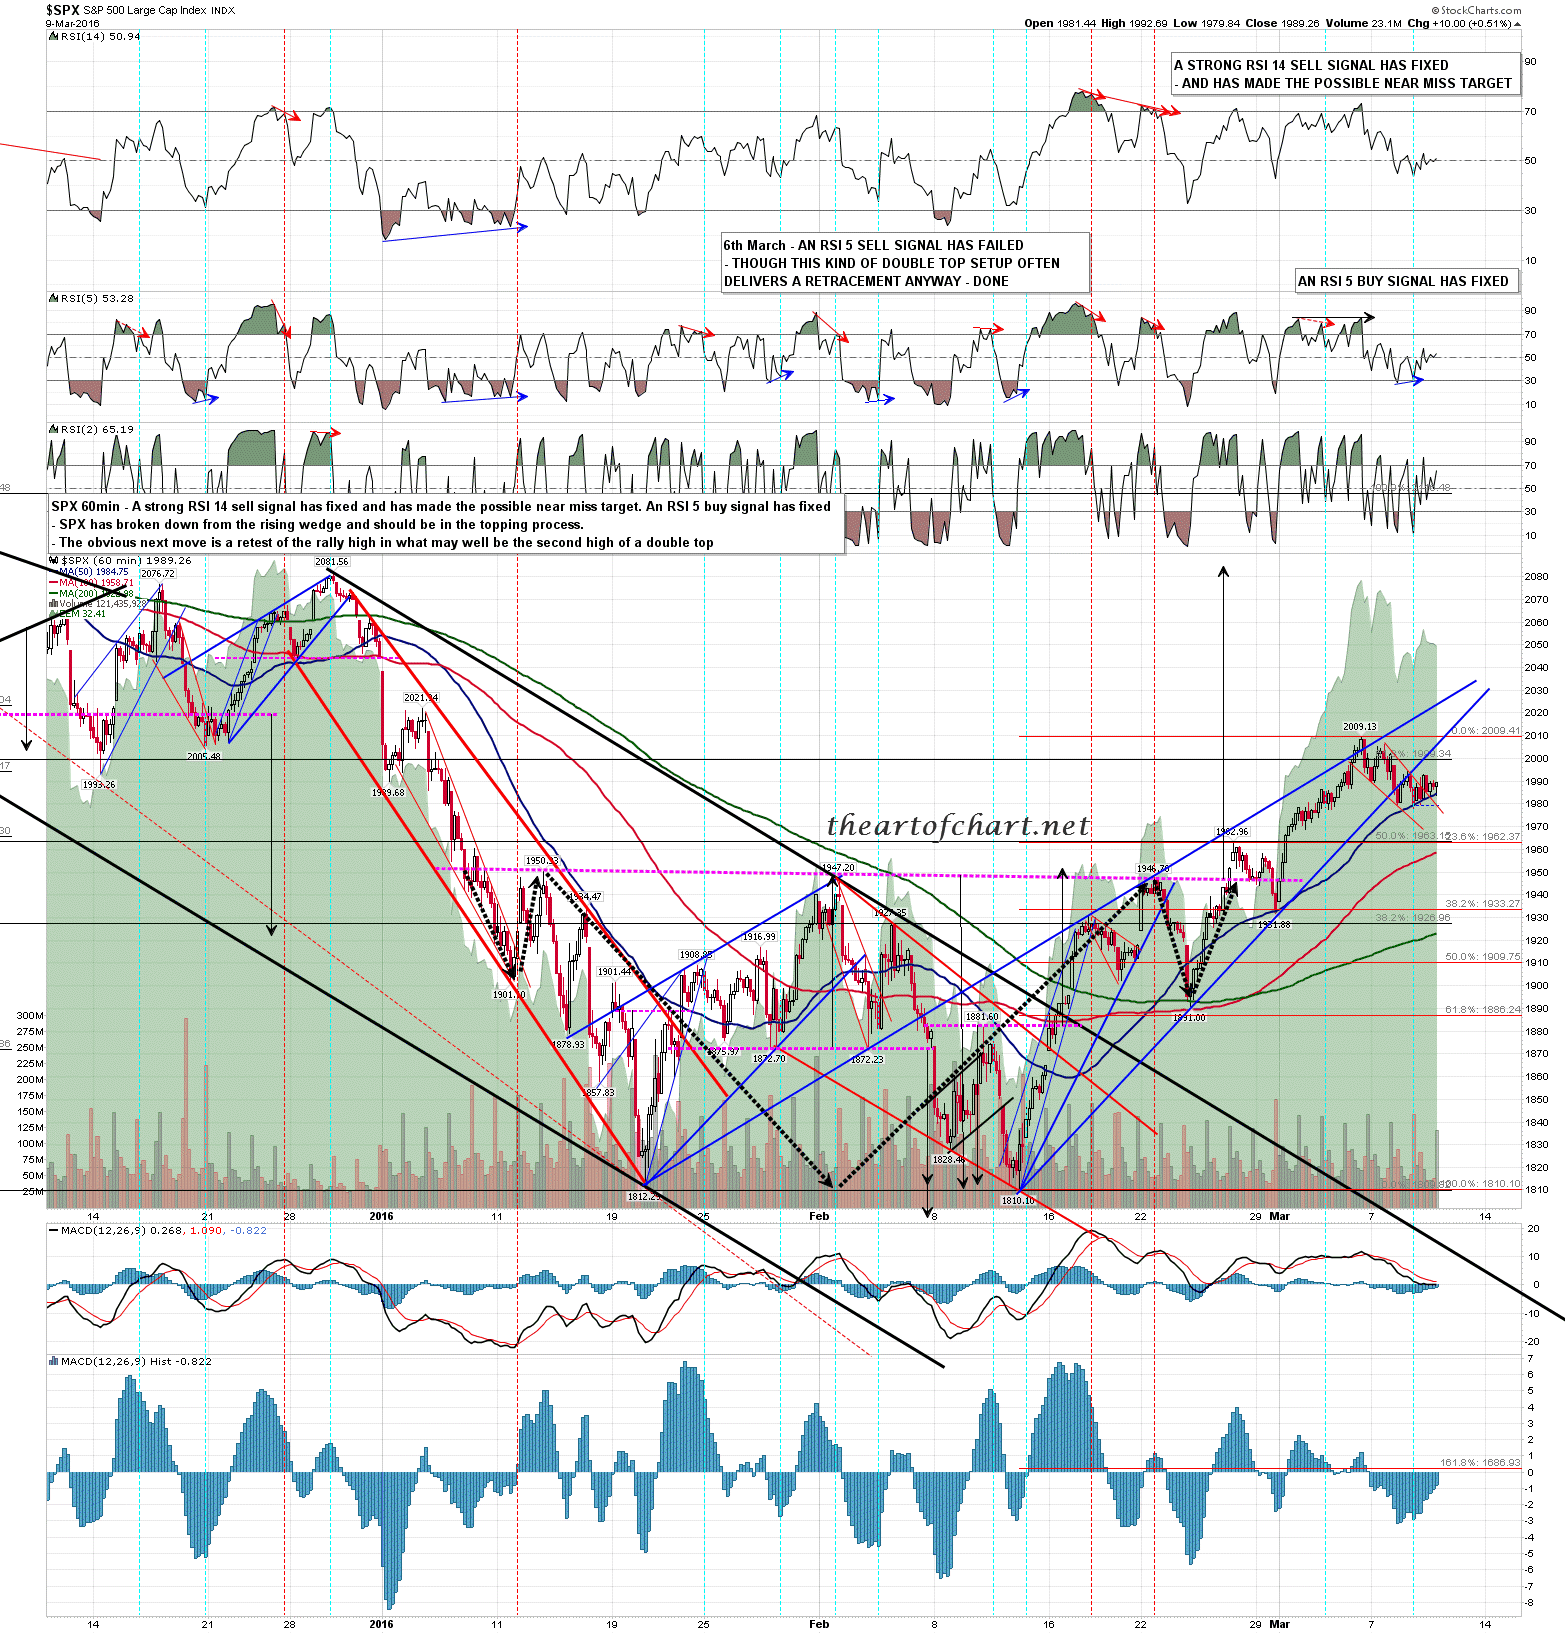
On the SPX 60min chart I’d particularly note the strong support at the 50 hour MA. That closed yesterday at 1985 and the a serious break of that support MA should signal that this rally high is in. As I said, we should really see at least an RTH retest of the rally high before that happens. SPX 60min chart:
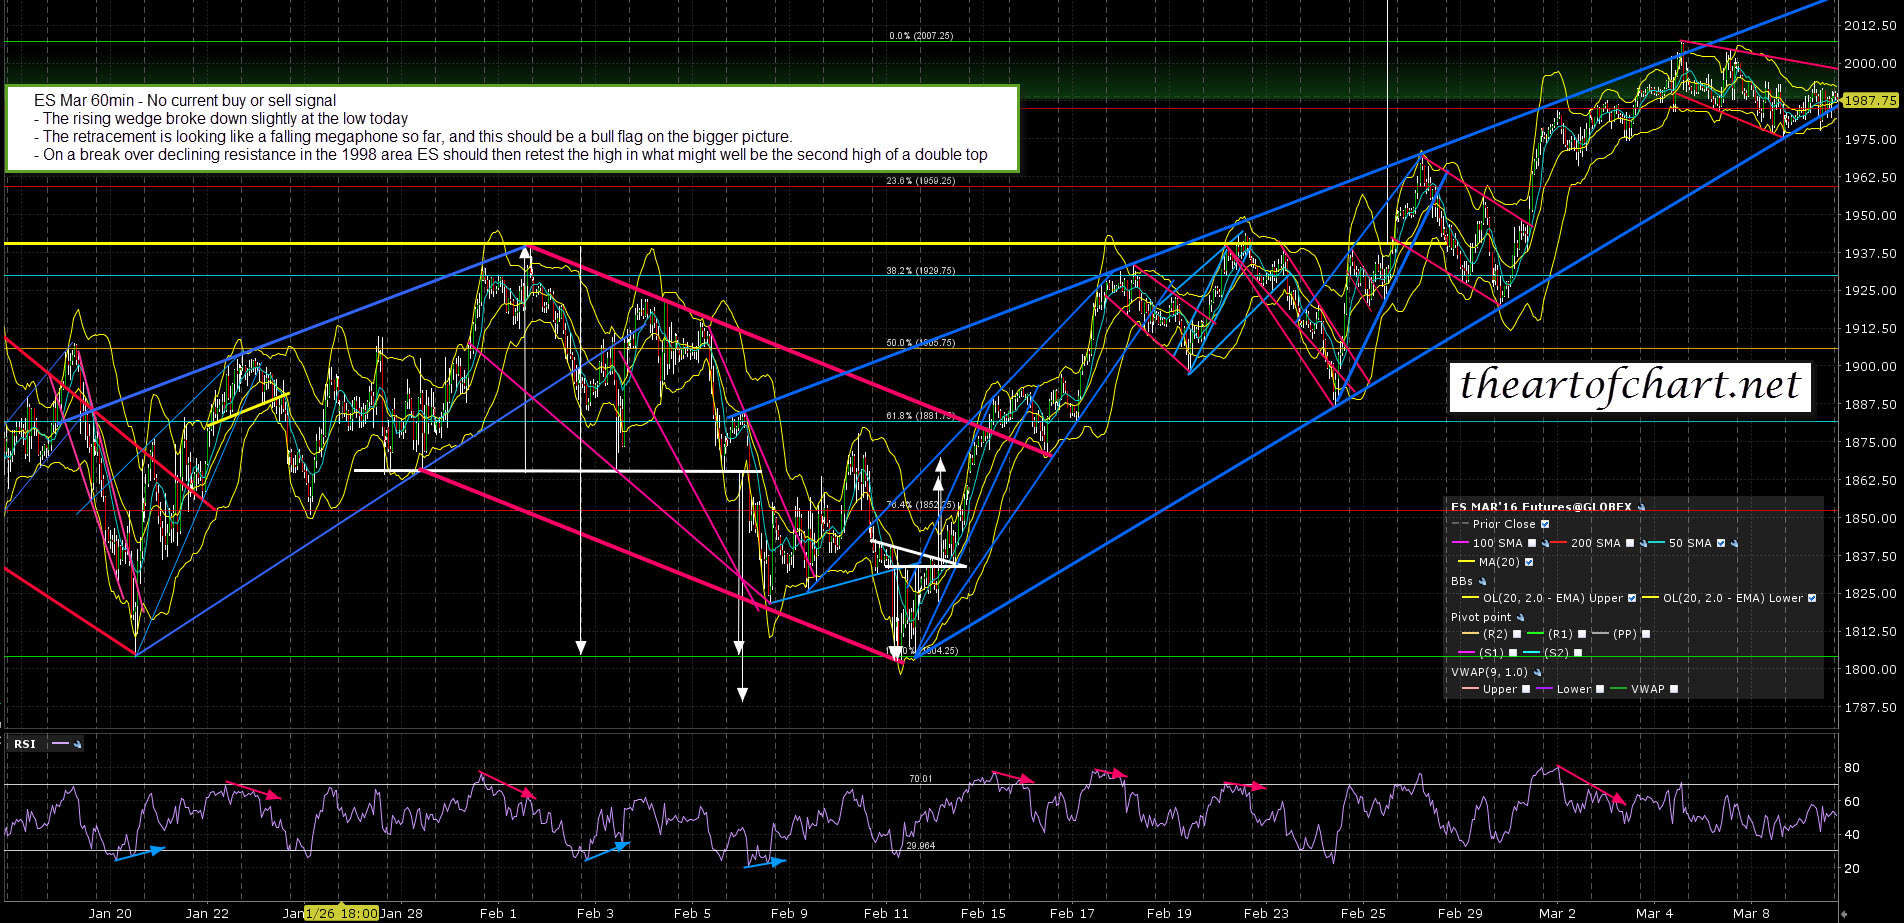
Obvious the weekly pivot on ES at 1976.3 held like a champ. If we see a break below that today or tomorrow then again, the rally is likely over. ES Mar 60min chart (from last night):
I have the SPX 200dma at 2021 and and am looking for a final high for this move ideally somewhere between the current high at 2011 and the 200dma at 2021. A sustained break over the 200dma seems unlikely but would be bullish.
I’ll be rolling onto the ES June contract for tomorrow’s post.
