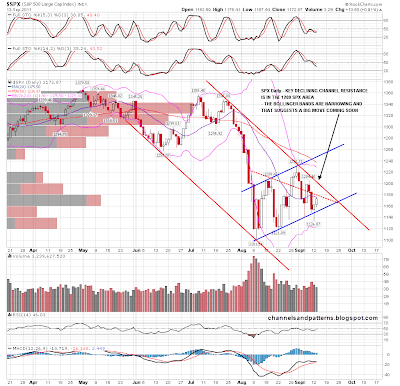
This latest bounce has been weak so far, but I'm thinking there should be a bit more life in it yet. I just have two SPX charts today as I'm still on vacation until next Tuesday, and have been coming under a little domestic pressure to spend less time on the markets, but between them they pretty much say it all about where we are now. On the SPX daily chart we can see the main declining channel from the highs this year. That gives us our line in the sand resistance level in the 1200 area, as with a daily close above that the declining channel will be broken:
On the SPX 60min chart you can see that shorter term declining channel resistance is in the 1185 area and it may be that this bounce gets no further than that. A break back below the blue channel support trendline would look very bearish:
I think a big move is coming and the current move looks corrective. While the main declining channel is unbroken I'm expecting that big move to be downwards. My main target at 1000-1020 is now in range within that declining channel. It might yet go the other way though, I'm surprised to see serious signs of weakness in precious metals and there are still definite signs of negative divergence on bonds, though with bonds particularly they tend to peak and trough before equities, so a high on bonds here wouldn't preclude a new low on equities.
I'm planning to start daily posts again when I'm back from vacation next Tuesday but may not manage every day before then. I'm not expecting to post Monday as I'll be travelling until halfway through the trading session.


