
On Wednesday night, after some seriously wild action had settled down a bit after hours, I made some educated guesses in my trading room about what ES/SPX might do over the next few days. Some of these I also talked about on twitter then and yesterday morning. They were as follows from ES 1842-3 at the time:
1. ES was making the second low of a double bottom targeting the 1855 area (Topped at 1857)
2. That move should make the second high of a double top (target 1821 area) (bottomed 1815)
3. An (Thursday) AM low would be made on SPX in the 1830-40 ES area (low was 1828)
4. SPX would then break up from an IHS with a target in the 1920 area (pending)
5. That 1920 area would be reached on Thurs/Fri this week (pending)
6. SPX would reverse back down hard to hit the 1789 double top target (pending)
6. That double-top target would be hit Tues – Thurs next week (pending)
So far those predictions have been doing ok, and we shall see whether SPX can hit the 1920 area and reverse there today. Assisting me in moving SPX to that (50% fibonacci retracement) target today may be my gnome assistant Janet Yellen, who will be making a statement an hour before the open today. That target would need to be reached in trading hours, and is supported by a double bottom target on ES in the 1913 area.
I posted the possible IHS forming on SPX yesterday morning, but the move yesterday was ambiguous, with a rising wedge having formed from Wednesday’s low. There are three main options here and I have listed those on the chart, but my preferred option is still that rally to the 1920 area and failure there. We shall see how that goes today. SPX 5min chart:
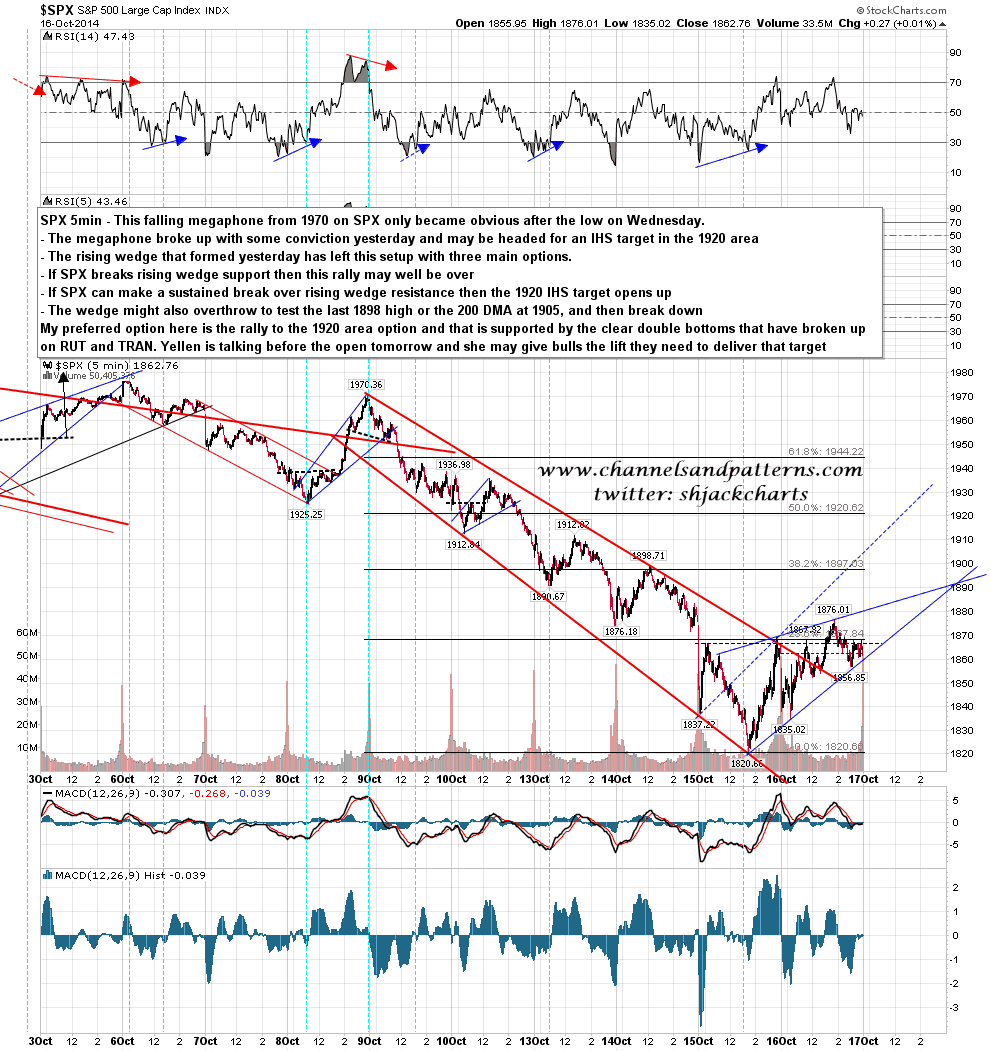
There are a couple of possible speed bumps on the way to that target. The first is Tuesday’s high at 1898.71 SPX, a whisker above the 38.2% fib retracement target at 1897. The second is broken support at the 200 DMA, now at 1906, but I’d be expecting any move back above the 200 DMA to be an intraday move only in any case, and no major technical damage to my scenario above would be done by a close today at or near that level. A hard fail into the close today would of course be better however. SPX daily chart:

If everything goes to plan,then where should the next (most likely final retracement) low be? Well my preferred target is the 1789 area, and on the weekly chart below you can see that as well as being the double-top target, it is also very close to rising megaphone support from the October 2011 low, and the 23.6% fib retracement of the move from that low. There is strong support in that area. If that support fails then there is strong support at the January low in the 1737 area and that would have a very good chance of holding. SPX weekly chart:
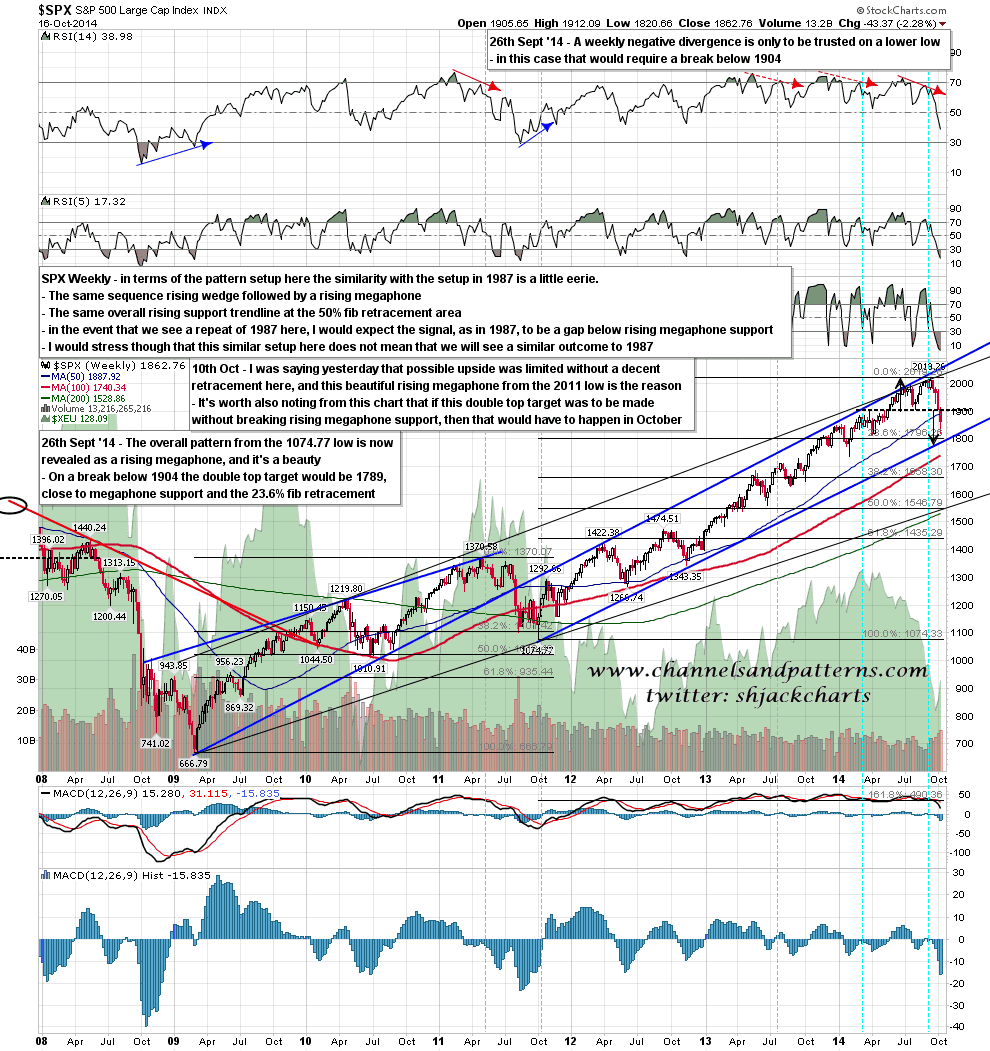
Both of these targets would be defined by the current rising megaphone from October 2011. In the first case SPX would be bouncing at megaphone support and heading back to megaphone resistance, now in the 2050 area and rising. In the second case the megaphone would break, and we would most likely then see a retest of the highs to form a larger double top before declining further. Both of these targets should be fairly easily made, but would most likely result in the next move up being limited by megaphone resistance, and therefore fairly boring.
There is a more interesting option that I’ve been looking at for a few months, but haven’t mentioned here before because I was concerned that the men in white coats might then show up at my door, put me in a straitjacket, and take me away to spend some quality time gibbering and drooling with the other deranged unfortunates who have publicly expressed doubts about the existence of an omniscient and omnipotent supreme being ….. that runs the Federal Reserve and will never allow a significant decline in equities to happen again.
This is just an option, and most likely won’t happen, but something similar has happened before in another October long ago, and the similarities with the setup here are at least thought-provoking. Now that we have seen enough market turbulence that people have started to remember that markets can sometimes go down rather than up, here is my chart of the 1980-7 period so that I can point out the areas of similarity with the setup today. SPX chart 1980-7:
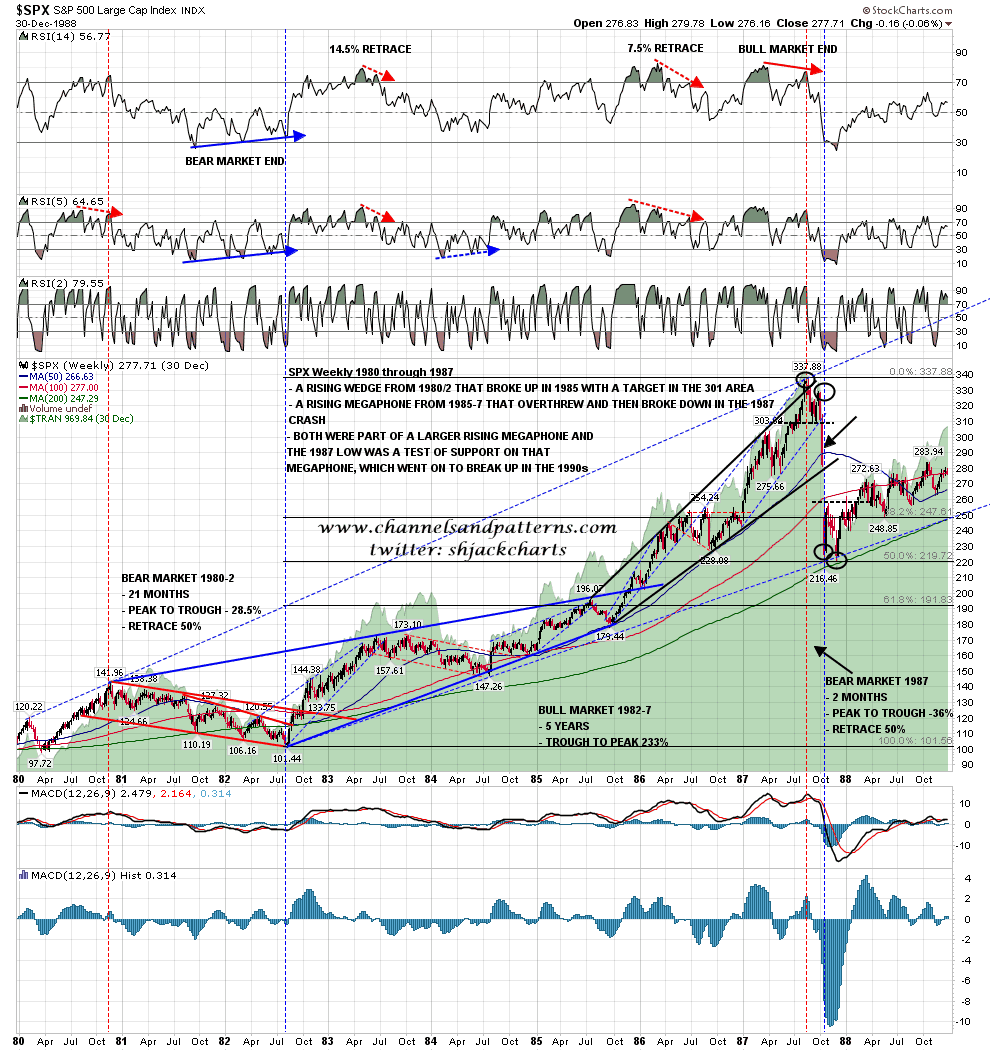
The points of similarity with the setup in early October 1987 here are as follows:
1. A five year strong bull run during which time the SPX more than tripled – CHECK
2. A extreme level of complacency at the highs – CHECK
3. Two main patterns in that 5 year run, first a rising wedge and second a rising megaphone – CHECK
4. An established support trendline at a 50% fib retracement level – CHECK
5. A clear weekly RSI 14 sell signal that was still far short of the 30 level target as megaphone support was approached – CHECK
6. A double top with a target at megaphone support that has broken down but has not quite hit megaphone support – CHECK
Why that last one? Because SPX never did hit that megaphone support trendline in 1987. SPX almost made it, so close that I dare say that some traders had already started scaling in long in anticipation of the next move up. We most likely won’t see a repeat of the 1987 ‘crash’ (just a fast bullish retracement really) here but the resemblance between these two setups is eerily close, and at the least I would suggest waiting to reverse long until megaphone support is actually hit, and definitely not rushing to buy the dip on a gap below megaphone support.
That 1550 area target is also attractive because it would do two other important things. It would break the current rising megaphone, which looks like comforting support now, but would quickly become confining resistance if we see a retracement low there. It would also retest massive broken resistance at the 2000 and 2007 highs, and the secular bear market pattern, for which those two highs defined the resistance trendline, that broke up in the first part of 2013. The target for that pattern is the 2450 area, and I posted that in June 2013. You can see that chart here. Again I was fairly quiet about that target then as I was already getting strange looks about the more modest 1965 wedge target that I announced with more fanfare then as well. If we were to see that 50% fib retrace and pattern retest, the obvious pattern target for the next move up would then be that 2450 SPX target, which would be a lot of fun.
Back to the situation this morning I’m disappointed to see that this current small correction after SPX has tripled in five years has failed to panic Yellen into action this morning, so if SPX is going to make 1920 today, it will most likely need to manage that without Fed assistance. The current 25 point gap up from the close yesterday looks cautiously encouraging, and we’ll see whether that can be done. I would warn that any longs are still counter-trend here in my view
