
Yesterday was a strange day to say the least. To start with SPX overshot the obvious H&S neckline by 11 handles, which weakened the H&S setup even though the bounce I was talking about yesterday morning then delivered in spades. That bounce was then apparently fuelled by the Fed unexpectedly reinstating $6bn of POMO that had previously been cancelled, and the bounce was a very strong squeeze that ran a very impressive 52 handles from low to high.
So what’s the takeaway, apart from the obvious that as well as distorting the economy on the bigger picture, the Fed can also make trading tricky on an intraday basis?
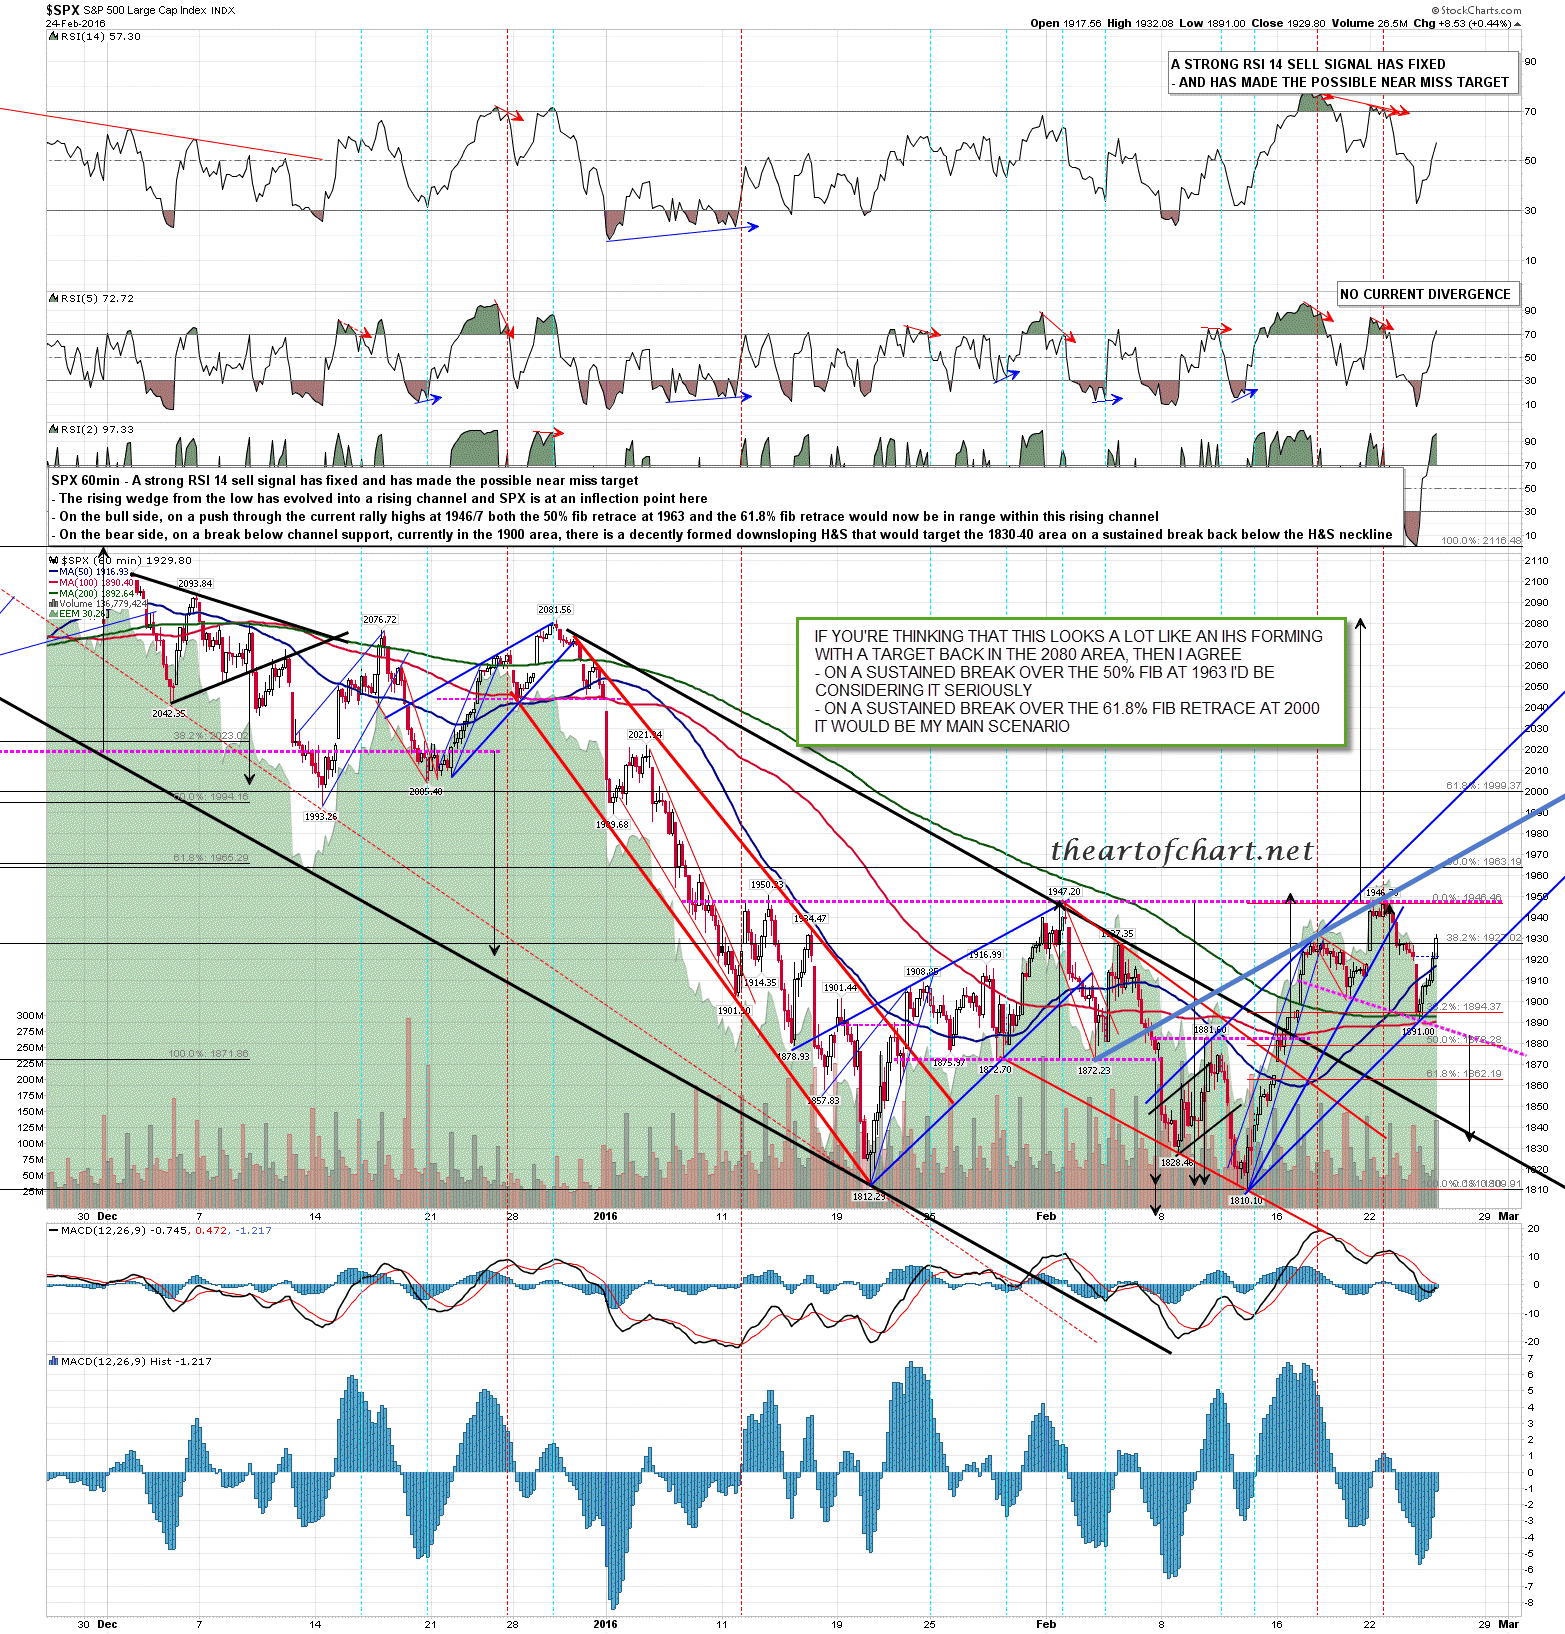
Well on a pure technical basis there is a possible H&S forming here on SPX, but there is also a wedge turned rising channel established at the low yesterday, with a very nice looking alternate larger rising wedge in play with wedge resistance currently in the 1960 area, slightly under the ideal rally target in the 1963 area at the 50% fib retrace target. If SPX can break over current rally resistance at 1946/7, then that would be a very attractive short term target. SPX 60min chart:
That larger rising wedge looks very similar on the ES chart, with the addition that the overnight retracement formed a clear bull flag that has now broken up with alternate targets at either the retest of the globex high at 1938.50 or the full flag target in the 1970 area. If we see a sustained break over the globex high at 1938.50, then this setup is inviting a test of the (SPX) 50% fib retrace at 1959 ES and 1963 SPX. ES 60min chart:
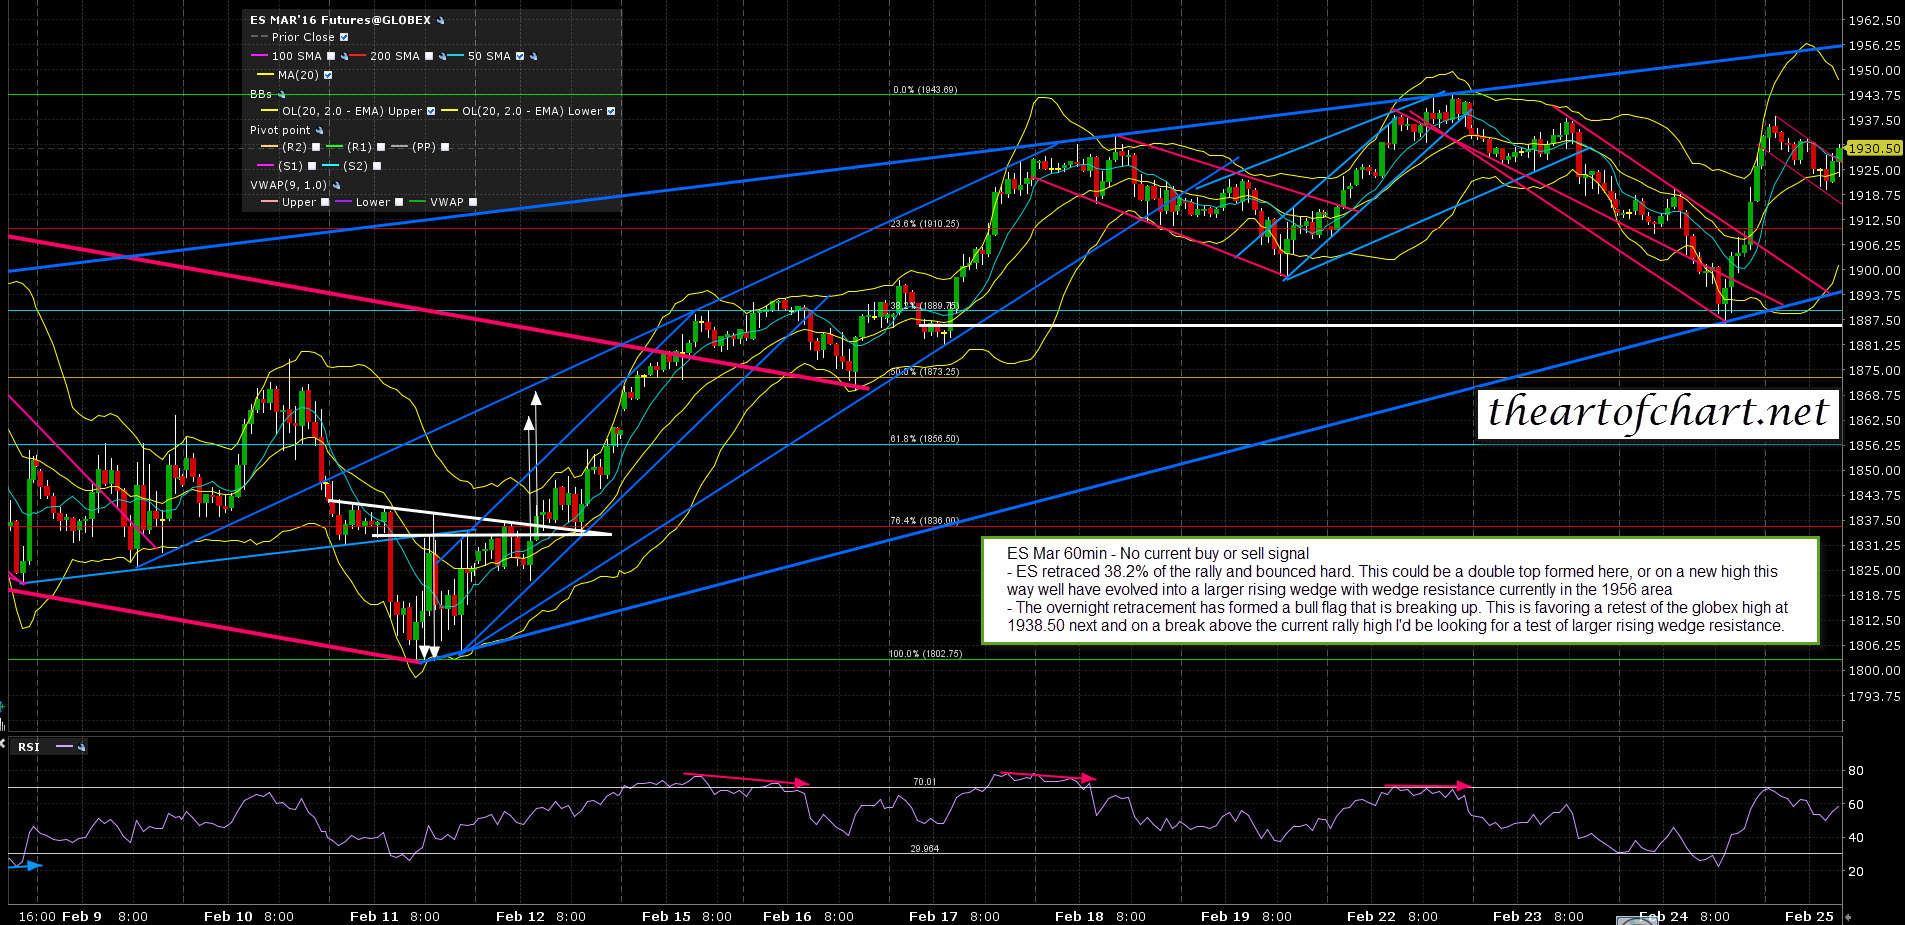
I’m watching with interest what happens at the retest of the 1938.50 globex high on ES. On a hard rejection there a possible double top would be in place that would target a retest of the ES weekly pivot at 1904 on a break below the strong support/resistance level at 1918/9 ES. On a sustained break over 1938.5 ES and a new rally high then I’d be looking for that test of the 50% fib retrace level at 1963 SPX, which was always the obvious target for this rally in any case.
One last comment today. I’ve noted on the SPX 60min chart that there is now a mostly and very well formed IHS on SPX that would target the 2090 area on a break back over the 1955 SPX area. This would be an excellent fit with a test of the 50% fib at 1963 and a hard fail there. If SPX sustains trade over 1963 and targets the 61.8% fib retrace at 2000, then I’ll be considering that IHS seriously as an alternate scenario. If SPX was to break back over strong resistance in the 2000-20 area at the 61.8% fib retrace target and above, then that IHS would become my main scenario. I’d be very surprised to see that happen, but I’ve been surprised before, and it needs to be mentioned as a possibility here.
