
I was saying on Thursday morning that predicting the direction on a cycle trend day was a very chancy business and so it was on Thursday. Despite tiny up volume at the open on Thursday the low of the day was in the first few minutes, and while it wasn’t a trend up day, buyers dominated the tape until the close. Thursday was an excellent example of a cycle trend day that wasn’t a full trend day in all respects, very much including the unexpected direction.
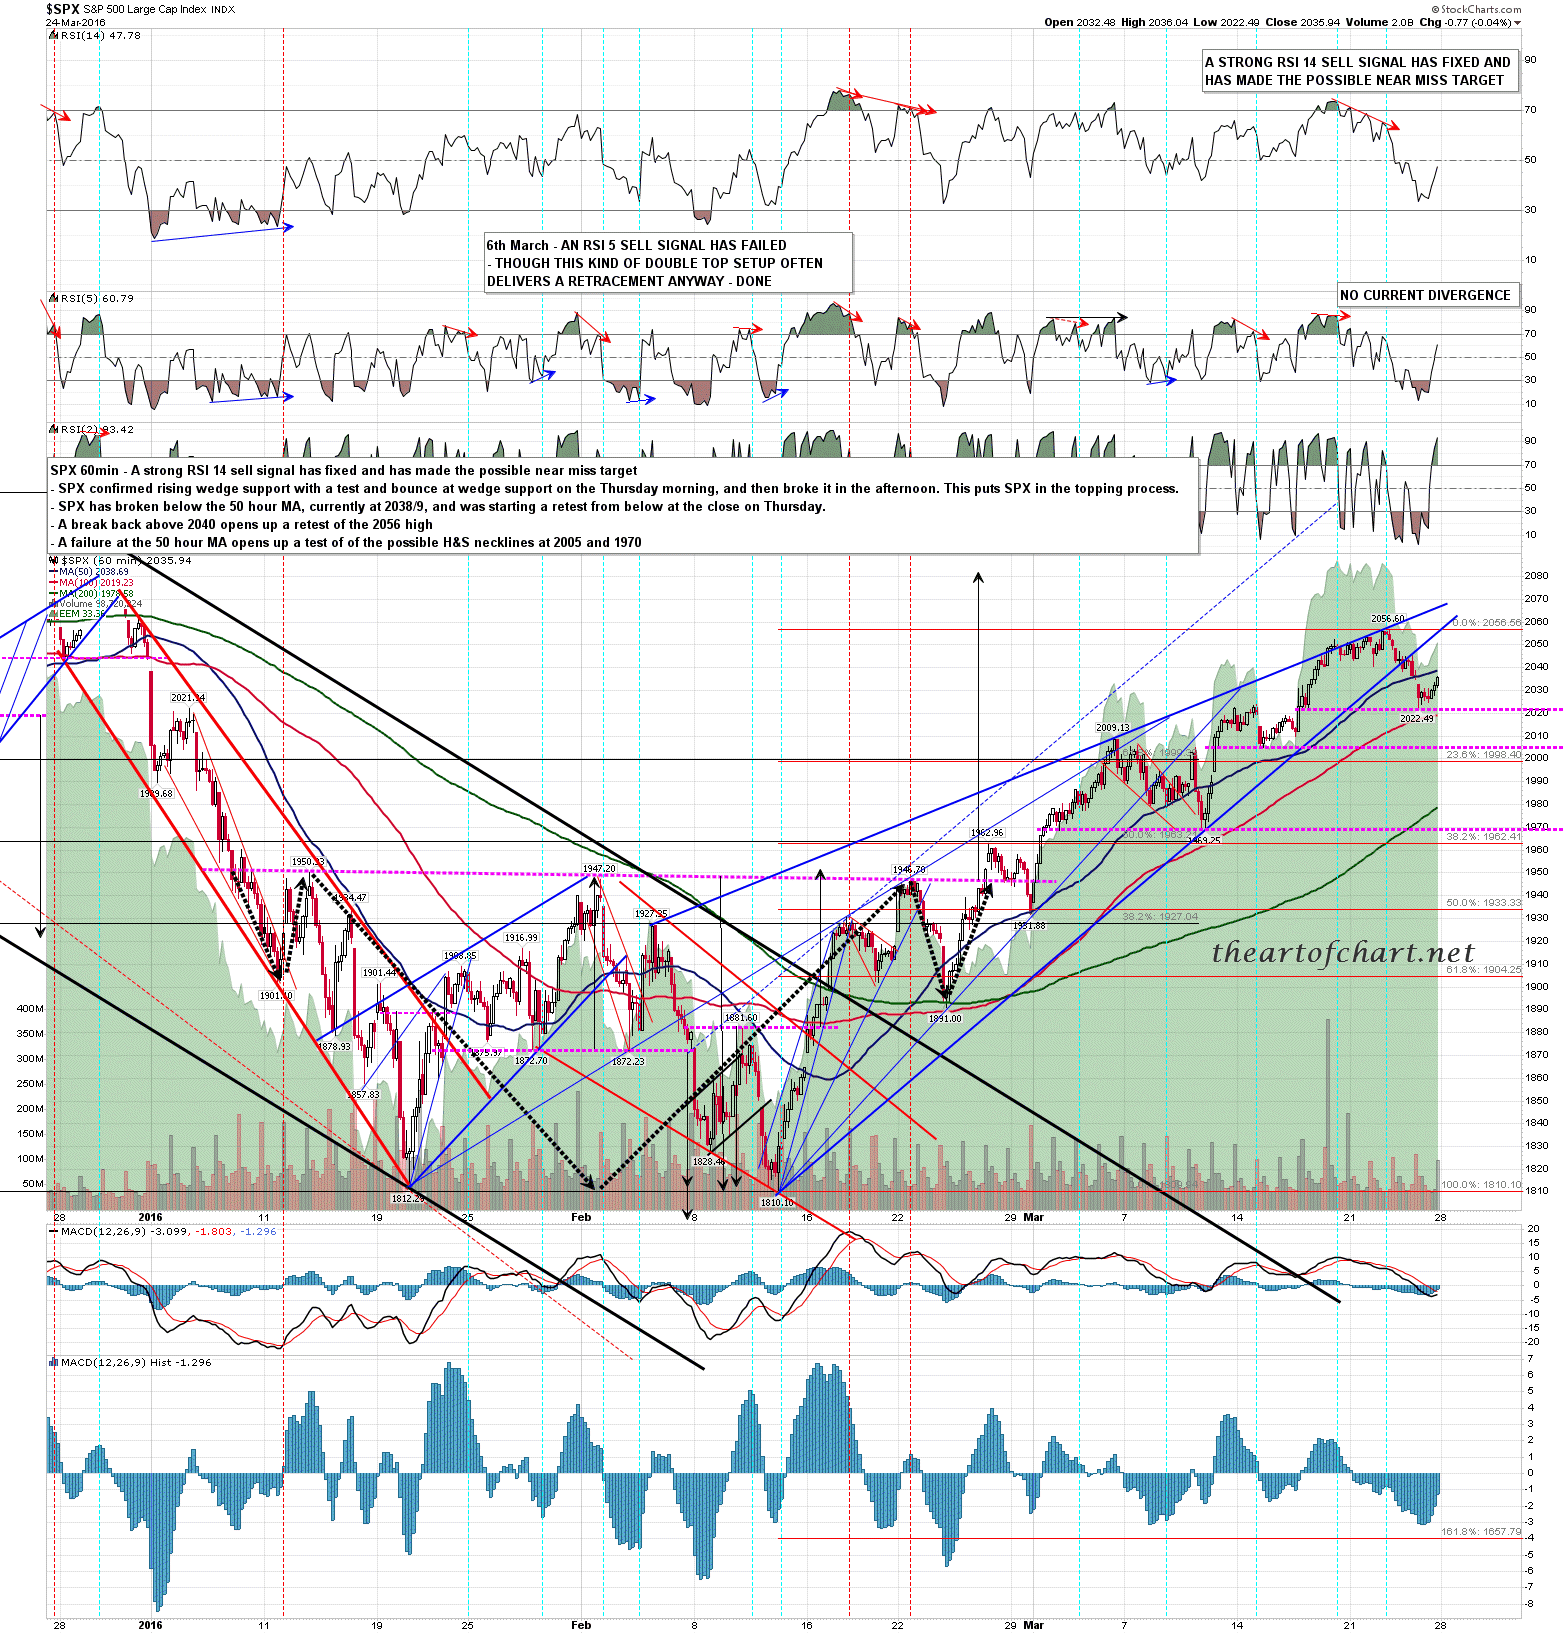
Moving onto today, the first thing that I would note from the SPX 60min chart is that the very important 50 hour MA was gapped through on Friday and was retested as resistance at the open today. That’s in the 2040 area now and a decent break back over that would open a retest of the current rally high at 2056.60. That would most likely make the second high of a double top though it might go a little higher in that event of course. If the 50 hour MA holds as resistance today, then on a break below Thursday’s low I would have an H&S target in the 1990 area, and would be watching the possible larger H&S necklines in the 2005 and 1970 areas. SPX 60min chart:
There’s a similar setup on the ES chart. This is the one I did for subscribers last night but not much has changed in practical TA terms since then. ES Jun 60min chart:
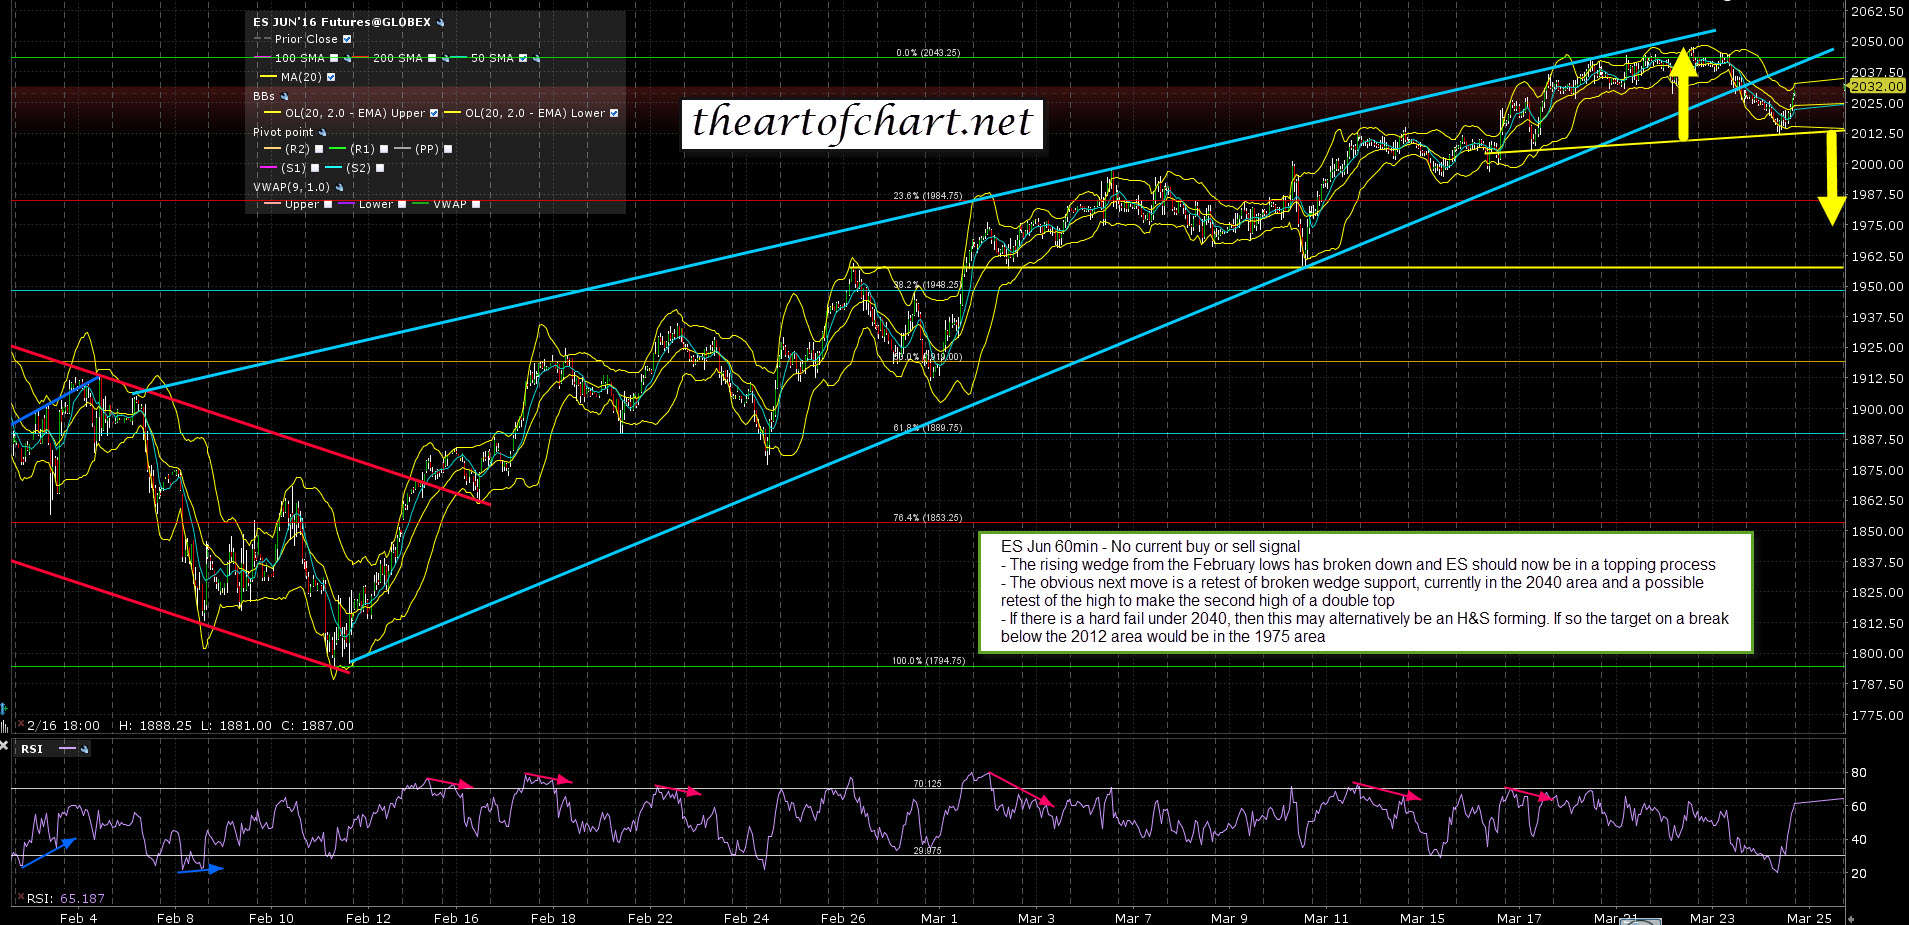
The new ES weekly pivot is at 2029.70, and that is a close match with resistance at the SPX 50 hour MA at 2040. That should be the key level today. If it holds as resistance then both will go down. If bulls can break back above and convert those to support, then both will go up. The bigger picture is pointing firmly down for at least a strong retrace, but a rally that has taken six weeks doesn’t tend to turn on a dime. I’m looking for a reversal pattern here and I’ve mentioned before that double tops/bottoms outnumber H&S patterns on SPX by more than two to one. We could very much still see a retest of that 2056.60 SPX high before the main decline gets going.
